 Sie haben Ihr Passwort vergessen?
Transportcontainer THE BARREL
Artikel 0 VON 0

Kunden, die diesen Artikel gekauft haben, kauften auch:
-
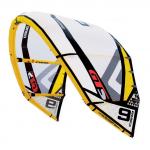
Kite NBK EVO 2010
 699,00 € * In den Warenkorbcl=oxwarticlebox(show/hide)Memory usage: 3.813 MB (peak: 3.876 MB)
System memory usage: 4 MB (peak: 4 MB)Executed: 2024-06-02 15:04:58Timestamp: 1717333498.7025Execution time:0.001
----------------------------------------------------------
Profile oxNew: 0.00793s 775.09% 119 * 7.0E-5s Profile oxAutoload: 0.00322s 315.12% 92 * 4.0E-5s Profile loadinglists: 0.0021s 205.06% 3 * 0.0007s Profile process: 0.00182s 177.81% 4 * 0.00045s Profile buildTree: 0.00098s 95.5% 1 * 0.00098s Profile seoencoder_loadFromCache: 0.00065s 63.37% 30 * 2.0E-5s Profile articleAssign: 0.00048s 46.7% 6 * 8.0E-5s Profile _getAmountPrice: 0.00046s 44.58% 2 * 0.00023s Profile getCategory: 0.00039s 38.41% 2 * 0.0002s Profile getArticleUri: 0.00034s 32.93% 1 * 0.00034s Profile executeMaintenanceTasks: 0.00015s 14.19% 1 * 0.00015s Profile _getLangTranslationArray: 9.0E-5s 9.04% 55 * 0s Profile _assignPriceInternal: 8.0E-5s 7.71% 2 * 4.0E-5s Profile smarty_function_oxmultilang: 8.0E-5s 7.46% 29 * 0s Profile isSearchEngine: 1.0E-5s 0.61% 1 * 1.0E-5s Profile articleAssignParentInternal: 0s 0.37% 6 * 0s Profile _applyVAT: 0s 0.37% 4 * 0s Profile fround: 0s 0.37% 12 * 0s Profile oxviewconfig::getViewConfigParam: 0s 0.28% 22 * 0s Profile oxviewconfig::setViewConfigParam: 0s 0.21% 12 * 0s -
Kuyichi 1/2 Sleeve Shirt
 cl=oxwarticlebox(show/hide)Memory usage: 3.846 MB (peak: 3.909 MB)
System memory usage: 4 MB (peak: 4 MB)Executed: 2024-06-02 15:04:58Timestamp: 1717333498.7032Execution time:0.0006
----------------------------------------------------------
Profile oxNew: 0.00794s 1227.3% 126 * 6.0E-5s Profile oxAutoload: 0.00322s 498.23% 92 * 4.0E-5s Profile process: 0.00246s 380.51% 5 * 0.00049s Profile loadinglists: 0.0021s 324.21% 3 * 0.0007s Profile buildTree: 0.00098s 150.99% 1 * 0.00098s Profile seoencoder_loadFromCache: 0.00065s 100.48% 32 * 2.0E-5s Profile getArticleUri: 0.00052s 79.73% 2 * 0.00026s Profile _getAmountPrice: 0.00051s 78.85% 3 * 0.00017s Profile articleAssign: 0.00048s 73.84% 6 * 8.0E-5s Profile getCategory: 0.00039s 60.72% 2 * 0.0002s Profile executeMaintenanceTasks: 0.00015s 22.44% 1 * 0.00015s Profile _getLangTranslationArray: 0.0001s 14.96% 59 * 0s Profile smarty_function_oxmultilang: 8.0E-5s 12.71% 32 * 0s Profile _assignPriceInternal: 8.0E-5s 12.68% 3 * 3.0E-5s Profile isSearchEngine: 1.0E-5s 0.96% 1 * 1.0E-5s Profile fround: 0s 0.74% 19 * 0s Profile articleAssignParentInternal: 0s 0.59% 6 * 0s Profile _applyVAT: 0s 0.59% 6 * 0s Profile oxviewconfig::getViewConfigParam: 0s 0.59% 23 * 0s Profile oxviewconfig::setViewConfigParam: 0s 0.33% 14 * 0s -
Trapez ION SOL KITE 2011
 cl=oxwarticlebox(show/hide)Memory usage: 3.862 MB (peak: 3.926 MB)
System memory usage: 4 MB (peak: 4 MB)Executed: 2024-06-02 15:04:58Timestamp: 1717333498.7038Execution time:0.0006
----------------------------------------------------------
Profile oxNew: 0.00795s 1305.91% 133 * 6.0E-5s Profile oxAutoload: 0.00322s 529.44% 92 * 4.0E-5s Profile process: 0.00307s 503.88% 6 * 0.00051s Profile loadinglists: 0.0021s 344.52% 3 * 0.0007s Profile buildTree: 0.00098s 160.45% 1 * 0.00098s Profile getArticleUri: 0.00068s 111.32% 3 * 0.00023s Profile seoencoder_loadFromCache: 0.00065s 107.09% 34 * 2.0E-5s Profile _getAmountPrice: 0.00056s 91.82% 4 * 0.00014s Profile articleAssign: 0.00048s 78.47% 6 * 8.0E-5s Profile getCategory: 0.00039s 64.53% 2 * 0.0002s Profile executeMaintenanceTasks: 0.00015s 23.84% 1 * 0.00015s Profile _getLangTranslationArray: 0.0001s 16.37% 63 * 0s Profile smarty_function_oxmultilang: 9.0E-5s 14.64% 35 * 0s Profile _assignPriceInternal: 8.0E-5s 13.82% 4 * 2.0E-5s Profile isSearchEngine: 1.0E-5s 1.02% 1 * 1.0E-5s Profile fround: 0s 0.78% 26 * 0s Profile articleAssignParentInternal: 0s 0.63% 6 * 0s Profile _applyVAT: 0s 0.63% 8 * 0s Profile oxviewconfig::getViewConfigParam: 0s 0.63% 24 * 0s Profile oxviewconfig::setViewConfigParam: 0s 0.51% 16 * 0s -
Kite CORE GTS
 cl=oxwarticlebox(show/hide)Memory usage: 3.895 MB (peak: 3.958 MB)
System memory usage: 4 MB (peak: 4 MB)Executed: 2024-06-02 15:04:58Timestamp: 1717333498.7045Execution time:0.0006
----------------------------------------------------------
Profile oxNew: 0.00796s 1283.47% 140 * 6.0E-5s Profile process: 0.00369s 594.27% 7 * 0.00053s Profile oxAutoload: 0.00322s 519.88% 92 * 4.0E-5s Profile loadinglists: 0.0021s 338.29% 3 * 0.0007s Profile buildTree: 0.00098s 157.55% 1 * 0.00098s Profile getArticleUri: 0.00085s 137.06% 4 * 0.00021s Profile seoencoder_loadFromCache: 0.00065s 105.34% 36 * 2.0E-5s Profile _getAmountPrice: 0.00061s 98.39% 5 * 0.00012s Profile articleAssign: 0.00048s 77.05% 6 * 8.0E-5s Profile getCategory: 0.00039s 63.36% 2 * 0.0002s Profile executeMaintenanceTasks: 0.00015s 23.41% 1 * 0.00015s Profile _getLangTranslationArray: 0.0001s 16.53% 67 * 0s Profile smarty_function_oxmultilang: 0.0001s 15.49% 38 * 0s Profile _assignPriceInternal: 9.0E-5s 13.88% 5 * 2.0E-5s Profile isSearchEngine: 1.0E-5s 1% 1 * 1.0E-5s Profile fround: 1.0E-5s 0.96% 33 * 0s Profile _applyVAT: 0s 0.77% 10 * 0s Profile oxviewconfig::getViewConfigParam: 0s 0.77% 25 * 0s Profile oxviewconfig::setViewConfigParam: 0s 0.65% 18 * 0s Profile articleAssignParentInternal: 0s 0.62% 6 * 0s -
Wakeboard LIQUID FORCE GROOVE 2010
 cl=oxwarticlebox(show/hide)Memory usage: 3.927 MB (peak: 3.99 MB)
System memory usage: 4 MB (peak: 4 MB)Executed: 2024-06-02 15:04:58Timestamp: 1717333498.7051Execution time:0.0006
----------------------------------------------------------
Profile oxNew: 0.00797s 1303.82% 147 * 5.0E-5s Profile process: 0.00429s 702.58% 8 * 0.00054s Profile oxAutoload: 0.00322s 527.58% 92 * 4.0E-5s Profile loadinglists: 0.0021s 343.31% 3 * 0.0007s Profile getArticleUri: 0.00103s 168.05% 5 * 0.00021s Profile buildTree: 0.00098s 159.89% 1 * 0.00098s Profile _getAmountPrice: 0.00066s 107.37% 6 * 0.00011s Profile seoencoder_loadFromCache: 0.00065s 107.06% 38 * 2.0E-5s Profile articleAssign: 0.00048s 78.19% 6 * 8.0E-5s Profile getCategory: 0.00039s 64.3% 2 * 0.0002s Profile executeMaintenanceTasks: 0.00015s 23.76% 1 * 0.00015s Profile _getLangTranslationArray: 0.00011s 17.28% 71 * 0s Profile smarty_function_oxmultilang: 0.0001s 16.86% 41 * 0s Profile _assignPriceInternal: 9.0E-5s 14.4% 6 * 1.0E-5s Profile isSearchEngine: 1.0E-5s 1.01% 1 * 1.0E-5s Profile fround: 1.0E-5s 0.98% 40 * 0s Profile _applyVAT: 1.0E-5s 0.98% 12 * 0s Profile oxviewconfig::setViewConfigParam: 1.0E-5s 0.82% 20 * 0s Profile oxviewconfig::getViewConfigParam: 0s 0.78% 26 * 0s Profile articleAssignParentInternal: 0s 0.62% 6 * 0s
cl=oxwarticledetails(show/hide)
Memory usage: 4.074 MB (peak: 4.304 MB)
System memory usage: 4 MB (peak: 4 MB)
----------------------------------------------------------
System memory usage: 4 MB (peak: 4 MB)
Executed: 2024-06-02 15:04:58
Timestamp: 1717333498.7077
Execution time:0.0025----------------------------------------------------------
| Profile oxNew: | 0.00823s | 323.7% | 158 | * | 5.0E-5s |
| Profile process: | 0.00781s | 306.98% | 9 | * | 0.00087s |
| Profile oxAutoload: | 0.00329s | 129.36% | 94 | * | 3.0E-5s |
| Profile loadinglists: | 0.00303s | 119.26% | 5 | * | 0.00061s |
| Profile getArticleUri: | 0.00103s | 40.38% | 5 | * | 0.00021s |
| Profile buildTree: | 0.00098s | 38.42% | 1 | * | 0.00098s |
| Profile _getAmountPrice: | 0.00066s | 25.8% | 6 | * | 0.00011s |
| Profile seoencoder_loadFromCache: | 0.00065s | 25.72% | 38 | * | 2.0E-5s |
| Profile articleAssign: | 0.00048s | 18.79% | 6 | * | 8.0E-5s |
| Profile getCategory: | 0.00039s | 15.45% | 2 | * | 0.0002s |
| Profile executeMaintenanceTasks: | 0.00015s | 5.71% | 1 | * | 0.00015s |
| Profile smarty_function_oxmultilang: | 0.00011s | 4.44% | 44 | * | 0s |
| Profile _getLangTranslationArray: | 0.00011s | 4.39% | 79 | * | 0s |
| Profile _assignPriceInternal: | 9.0E-5s | 3.46% | 6 | * | 1.0E-5s |
| Profile isSearchEngine: | 1.0E-5s | 0.24% | 1 | * | 1.0E-5s |
| Profile fround: | 1.0E-5s | 0.23% | 40 | * | 0s |
| Profile _applyVAT: | 1.0E-5s | 0.23% | 12 | * | 0s |
| Profile oxviewconfig::setViewConfigParam: | 1.0E-5s | 0.2% | 23 | * | 0s |
| Profile oxviewconfig::getViewConfigParam: | 0s | 0.19% | 28 | * | 0s |
| Profile articleAssignParentInternal: | 0s | 0.15% | 6 | * | 0s |