ärmellos
träger
shirt
pima
lässig
longsleeve
locker
liquid force
langarm
kuyichi
kurz
kiteboarding
kiteboard
kite
jeans
gerade
dunkel
board
anna
2010
Mehr...
cl=oxwcookienote(show/hide)
Memory usage: 2.942 MB (peak: 2.991 MB)
System memory usage: 2 MB (peak: 2 MB)
Execution time:0.005
----------------------------------------------------------
System memory usage: 2 MB (peak: 2 MB)
Execution time:0.005
----------------------------------------------------------
| Profile process: | 0.02691s | 539.35% | 4 | * | 0.00673s |
| Profile oxNew: | 0.01261s | 252.71% | 96 | * | 0.00013s |
| Profile _getLangTranslationArray: | 0.00832s | 166.87% | 21 | * | 0.0004s |
| Profile smarty_function_oxmultilang: | 0.00831s | 166.63% | 12 | * | 0.00069s |
| Profile buildTree: | 0.00776s | 155.57% | 1 | * | 0.00776s |
| Profile _assignPriceInternal: | 0.00616s | 123.56% | 2 | * | 0.00308s |
| Profile _getAmountPrice: | 0.0051s | 102.23% | 2 | * | 0.00255s |
| Profile oxAutoload: | 0.00408s | 81.85% | 83 | * | 5.0E-5s |
| Profile generatePageNavigation: | 0.00238s | 47.74% | 2 | * | 0.00119s |
| Profile loadinglists: | 0.00182s | 36.56% | 1 | * | 0.00182s |
| Profile seoencoder_loadFromCache: | 0.00096s | 19.16% | 18 | * | 5.0E-5s |
| Profile articleAssign: | 0.00052s | 10.48% | 2 | * | 0.00026s |
| Profile executeMaintenanceTasks: | 0.00025s | 5.08% | 1 | * | 0.00025s |
| Profile fround: | 4.0E-5s | 0.84% | 23 | * | 0s |
| Profile _applyVAT: | 3.0E-5s | 0.52% | 4 | * | 1.0E-5s |
| Profile isSearchEngine: | 2.0E-5s | 0.36% | 1 | * | 2.0E-5s |
| Profile oxviewconfig::getViewConfigParam: | 1.0E-5s | 0.19% | 6 | * | 0s |
| Profile oxviewconfig::setViewConfigParam: | 1.0E-5s | 0.14% | 6 | * | 0s |
| Profile articleAssignParentInternal: | 0s | 0.08% | 2 | * | 0s |
cl=oxwlanguagelist(show/hide)
Memory usage: 2.981 MB (peak: 3.028 MB)
System memory usage: 2 MB (peak: 2 MB)
----------------------------------------------------------
System memory usage: 2 MB (peak: 2 MB)
Executed: 2024-05-24 08:52:37
Timestamp: 1716533557.7862
Execution time:0.0014----------------------------------------------------------
| Profile process: | 0.0283s | 2011.27% | 5 | * | 0.00566s |
| Profile oxNew: | 0.01283s | 912.17% | 99 | * | 0.00013s |
| Profile _getLangTranslationArray: | 0.00833s | 592.2% | 22 | * | 0.00038s |
| Profile smarty_function_oxmultilang: | 0.00831s | 590.87% | 12 | * | 0.00069s |
| Profile buildTree: | 0.00776s | 551.64% | 1 | * | 0.00776s |
| Profile _assignPriceInternal: | 0.00616s | 438.13% | 2 | * | 0.00308s |
| Profile _getAmountPrice: | 0.0051s | 362.5% | 2 | * | 0.00255s |
| Profile oxAutoload: | 0.00412s | 292.66% | 84 | * | 5.0E-5s |
| Profile generatePageNavigation: | 0.00238s | 169.29% | 2 | * | 0.00119s |
| Profile loadinglists: | 0.00182s | 129.66% | 1 | * | 0.00182s |
| Profile seoencoder_loadFromCache: | 0.00096s | 67.95% | 18 | * | 5.0E-5s |
| Profile articleAssign: | 0.00052s | 37.16% | 2 | * | 0.00026s |
| Profile executeMaintenanceTasks: | 0.00025s | 18% | 1 | * | 0.00025s |
| Profile fround: | 4.0E-5s | 2.97% | 23 | * | 0s |
| Profile _applyVAT: | 3.0E-5s | 1.83% | 4 | * | 1.0E-5s |
| Profile isSearchEngine: | 2.0E-5s | 1.27% | 1 | * | 2.0E-5s |
| Profile oxviewconfig::getViewConfigParam: | 1.0E-5s | 0.8% | 8 | * | 0s |
| Profile oxviewconfig::setViewConfigParam: | 1.0E-5s | 0.63% | 9 | * | 0s |
| Profile articleAssignParentInternal: | 0s | 0.29% | 2 | * | 0s |
cl=oxwcurrencylist(show/hide)
Memory usage: 3.032 MB (peak: 3.079 MB)
System memory usage: 2 MB (peak: 2 MB)
----------------------------------------------------------
System memory usage: 2 MB (peak: 2 MB)
Executed: 2024-05-24 08:52:37
Timestamp: 1716533557.7874
Execution time:0.0011----------------------------------------------------------
| Profile process: | 0.02936s | 2723.91% | 6 | * | 0.00489s |
| Profile oxNew: | 0.01306s | 1211.19% | 102 | * | 0.00013s |
| Profile _getLangTranslationArray: | 0.00834s | 773.52% | 23 | * | 0.00036s |
| Profile smarty_function_oxmultilang: | 0.00831s | 771.22% | 12 | * | 0.00069s |
| Profile buildTree: | 0.00776s | 720.02% | 1 | * | 0.00776s |
| Profile _assignPriceInternal: | 0.00616s | 571.86% | 2 | * | 0.00308s |
| Profile _getAmountPrice: | 0.0051s | 473.15% | 2 | * | 0.00255s |
| Profile oxAutoload: | 0.00415s | 384.87% | 85 | * | 5.0E-5s |
| Profile generatePageNavigation: | 0.00238s | 220.97% | 2 | * | 0.00119s |
| Profile loadinglists: | 0.00182s | 169.23% | 1 | * | 0.00182s |
| Profile seoencoder_loadFromCache: | 0.00096s | 88.7% | 18 | * | 5.0E-5s |
| Profile articleAssign: | 0.00052s | 48.51% | 2 | * | 0.00026s |
| Profile executeMaintenanceTasks: | 0.00025s | 23.49% | 1 | * | 0.00025s |
| Profile fround: | 4.0E-5s | 3.87% | 23 | * | 0s |
| Profile _applyVAT: | 3.0E-5s | 2.39% | 4 | * | 1.0E-5s |
| Profile isSearchEngine: | 2.0E-5s | 1.66% | 1 | * | 2.0E-5s |
| Profile oxviewconfig::getViewConfigParam: | 1.0E-5s | 1.24% | 9 | * | 0s |
| Profile oxviewconfig::setViewConfigParam: | 1.0E-5s | 1% | 11 | * | 0s |
| Profile articleAssignParentInternal: | 0s | 0.38% | 2 | * | 0s |
-
Anmelden
 Sie haben Ihr Passwort vergessen?
Kein Problem! Hier können Sie ein neues Passwort einrichten.
Sie erhalten eine E-Mail mit einem Link, um ein neues Passwort zu vergeben.
Sollten Sie innerhalb der nächsten Minuten KEINE E-Mail mit Ihren Zugangsdaten erhalten, so überprüfen Sie bitte: Haben Sie sich in unserem Shop bereits registriert? Wenn nicht, so tun Sie dies bitte einmalig im Rahmen des Bestellprozesses. Sie können dann selbst ein Passwort festlegen. Sobald Sie registriert sind, können Sie sich in Zukunft mit Ihrer E-Mail-Adresse und Ihrem Passwort einloggen.- Wenn Sie sich sicher sind, dass Sie sich in unserem Shop bereits registriert haben, dann überprüfen Sie bitte, ob Sie sich bei der Eingabe Ihrer E-Mail-Adresse evtl. vertippt haben.
Sollten Sie trotz korrekter E-Mail-Adresse und bereits bestehender Registrierung weiterhin Probleme mit dem Login haben und auch keine "Passwort vergessen"-E-Mail erhalten, so wenden Sie sich bitte per E-Mail an:
- Registrieren
cl=oxwservicemenu(show/hide)
Memory usage: 3.203 MB (peak: 3.277 MB)
System memory usage: 2 MB (peak: 2 MB)
Execution time:0.0161
----------------------------------------------------------
System memory usage: 2 MB (peak: 2 MB)
Execution time:0.0161
----------------------------------------------------------
| Profile process: | 0.04548s | 281.76% | 7 | * | 0.0065s |
| Profile oxNew: | 0.01363s | 84.46% | 107 | * | 0.00013s |
| Profile smarty_function_oxmultilang: | 0.00849s | 52.61% | 35 | * | 0.00024s |
| Profile _getLangTranslationArray: | 0.00839s | 51.99% | 48 | * | 0.00017s |
| Profile buildTree: | 0.00776s | 48.08% | 1 | * | 0.00776s |
| Profile _assignPriceInternal: | 0.00616s | 38.19% | 2 | * | 0.00308s |
| Profile _getAmountPrice: | 0.0051s | 31.59% | 2 | * | 0.00255s |
| Profile oxAutoload: | 0.00428s | 26.53% | 87 | * | 5.0E-5s |
| Profile generatePageNavigation: | 0.00238s | 14.76% | 2 | * | 0.00119s |
| Profile loadinglists: | 0.00182s | 11.3% | 1 | * | 0.00182s |
| Profile seoencoder_loadFromCache: | 0.00097s | 6.02% | 23 | * | 4.0E-5s |
| Profile articleAssign: | 0.00052s | 3.24% | 2 | * | 0.00026s |
| Profile parseThroughSmarty: | 0.00028s | 1.72% | 1 | * | 0.00028s |
| Profile executeMaintenanceTasks: | 0.00025s | 1.57% | 1 | * | 0.00025s |
| Profile fround: | 4.0E-5s | 0.26% | 23 | * | 0s |
| Profile _applyVAT: | 3.0E-5s | 0.16% | 4 | * | 1.0E-5s |
| Profile oxviewconfig::getViewConfigParam: | 2.0E-5s | 0.12% | 22 | * | 0s |
| Profile isSearchEngine: | 2.0E-5s | 0.11% | 1 | * | 2.0E-5s |
| Profile oxviewconfig::setViewConfigParam: | 2.0E-5s | 0.1% | 18 | * | 0s |
| Profile articleAssignParentInternal: | 0s | 0.03% | 2 | * | 0s |
cl=oxwcategorytree(show/hide)
Memory usage: 3.302 MB (peak: 3.358 MB)
System memory usage: 2 MB (peak: 2 MB)
----------------------------------------------------------
System memory usage: 2 MB (peak: 2 MB)
Executed: 2024-05-24 08:52:37
Timestamp: 1716533557.8068
Execution time:0.0028----------------------------------------------------------
| Profile process: | 0.0483s | 1700.75% | 8 | * | 0.00604s |
| Profile oxNew: | 0.01429s | 503.21% | 112 | * | 0.00013s |
| Profile smarty_function_oxmultilang: | 0.00853s | 300.29% | 37 | * | 0.00023s |
| Profile _getLangTranslationArray: | 0.00841s | 295.99% | 51 | * | 0.00016s |
| Profile buildTree: | 0.00776s | 273.27% | 1 | * | 0.00776s |
| Profile _assignPriceInternal: | 0.00616s | 217.04% | 2 | * | 0.00308s |
| Profile _getAmountPrice: | 0.0051s | 179.58% | 2 | * | 0.00255s |
| Profile oxAutoload: | 0.00446s | 157.14% | 90 | * | 5.0E-5s |
| Profile generatePageNavigation: | 0.00238s | 83.87% | 2 | * | 0.00119s |
| Profile loadinglists: | 0.00182s | 64.23% | 1 | * | 0.00182s |
| Profile seoencoder_loadFromCache: | 0.00126s | 44.44% | 39 | * | 3.0E-5s |
| Profile articleAssign: | 0.00052s | 18.41% | 2 | * | 0.00026s |
| Profile parseThroughSmarty: | 0.00028s | 9.75% | 1 | * | 0.00028s |
| Profile executeMaintenanceTasks: | 0.00025s | 8.92% | 1 | * | 0.00025s |
| Profile getCategoryUri: | 0.00025s | 8.8% | 14 | * | 2.0E-5s |
| Profile fround: | 4.0E-5s | 1.47% | 23 | * | 0s |
| Profile _applyVAT: | 3.0E-5s | 0.91% | 4 | * | 1.0E-5s |
| Profile oxviewconfig::getViewConfigParam: | 2.0E-5s | 0.75% | 26 | * | 0s |
| Profile isSearchEngine: | 2.0E-5s | 0.63% | 1 | * | 2.0E-5s |
| Profile oxviewconfig::setViewConfigParam: | 2.0E-5s | 0.61% | 22 | * | 0s |
| Profile articleAssignParentInternal: | 0s | 0.14% | 2 | * | 0s |

cl=oxwminibasket(show/hide)
Memory usage: 3.339 MB (peak: 3.373 MB)
System memory usage: 2 MB (peak: 2 MB)
----------------------------------------------------------
System memory usage: 2 MB (peak: 2 MB)
Executed: 2024-05-24 08:52:37
Timestamp: 1716533557.8093
Execution time:0.0024----------------------------------------------------------
| Profile process: | 0.05064s | 2128.63% | 9 | * | 0.00563s |
| Profile oxNew: | 0.01451s | 609.94% | 115 | * | 0.00013s |
| Profile smarty_function_oxmultilang: | 0.00853s | 358.5% | 37 | * | 0.00023s |
| Profile _getLangTranslationArray: | 0.00842s | 353.78% | 52 | * | 0.00016s |
| Profile buildTree: | 0.00776s | 326.24% | 1 | * | 0.00776s |
| Profile _assignPriceInternal: | 0.00616s | 259.11% | 2 | * | 0.00308s |
| Profile _getAmountPrice: | 0.0051s | 214.38% | 2 | * | 0.00255s |
| Profile oxAutoload: | 0.0045s | 189.07% | 91 | * | 5.0E-5s |
| Profile generatePageNavigation: | 0.00238s | 100.12% | 2 | * | 0.00119s |
| Profile loadinglists: | 0.00182s | 76.68% | 1 | * | 0.00182s |
| Profile seoencoder_loadFromCache: | 0.00126s | 53.06% | 39 | * | 3.0E-5s |
| Profile articleAssign: | 0.00052s | 21.98% | 2 | * | 0.00026s |
| Profile parseThroughSmarty: | 0.00028s | 11.65% | 1 | * | 0.00028s |
| Profile executeMaintenanceTasks: | 0.00025s | 10.64% | 1 | * | 0.00025s |
| Profile getCategoryUri: | 0.00025s | 10.5% | 14 | * | 2.0E-5s |
| Profile fround: | 4.0E-5s | 1.75% | 23 | * | 0s |
| Profile _applyVAT: | 3.0E-5s | 1.08% | 4 | * | 1.0E-5s |
| Profile oxviewconfig::getViewConfigParam: | 2.0E-5s | 0.89% | 26 | * | 0s |
| Profile oxviewconfig::setViewConfigParam: | 2.0E-5s | 0.77% | 23 | * | 0s |
| Profile isSearchEngine: | 2.0E-5s | 0.75% | 1 | * | 2.0E-5s |
| Profile articleAssignParentInternal: | 0s | 0.17% | 2 | * | 0s |
Boots
-
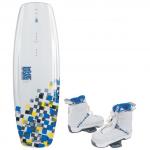
Set O'BRIEN DECADE 2010
 cl=oxwarticlebox(show/hide)Memory usage: 2.823 MB (peak: 2.938 MB)
System memory usage: 2 MB (peak: 2 MB)Executed: 2024-05-24 08:52:37Timestamp: 1716533557.771Execution time:0.0159
----------------------------------------------------------
Profile process: 0.0157s 98.87% 2 * 0.00785s Profile oxNew: 0.01231s 77.49% 84 * 0.00015s Profile _getLangTranslationArray: 0.00829s 52.2% 15 * 0.00055s Profile smarty_function_oxmultilang: 0.00828s 52.13% 10 * 0.00083s Profile buildTree: 0.00776s 48.87% 1 * 0.00776s Profile _assignPriceInternal: 0.00615s 38.73% 1 * 0.00615s Profile oxAutoload: 0.00405s 25.52% 82 * 5.0E-5s Profile generatePageNavigation: 0.00217s 13.66% 1 * 0.00217s Profile loadinglists: 0.00182s 11.49% 1 * 0.00182s Profile _getAmountPrice: 0.00119s 7.51% 1 * 0.00119s Profile seoencoder_loadFromCache: 0.00094s 5.94% 16 * 6.0E-5s Profile articleAssign: 0.00052s 3.29% 2 * 0.00026s Profile executeMaintenanceTasks: 0.00025s 1.59% 1 * 0.00025s Profile fround: 4.0E-5s 0.23% 17 * 0s Profile isSearchEngine: 2.0E-5s 0.11% 1 * 2.0E-5s Profile _applyVAT: 2.0E-5s 0.1% 2 * 1.0E-5s Profile oxviewconfig::getViewConfigParam: 1.0E-5s 0.05% 5 * 0s Profile oxviewconfig::setViewConfigParam: 0s 0.03% 3 * 0s Profile articleAssignParentInternal: 0s 0.03% 2 * 0s -
Set O'BRIEN VICE 2010
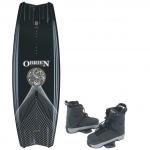 599,00 € * In den Warenkorbcl=oxwarticlebox(show/hide)Memory usage: 2.84 MB (peak: 2.991 MB)
System memory usage: 2 MB (peak: 2 MB)Executed: 2024-05-24 08:52:37Timestamp: 1716533557.7775Execution time:0.0063
----------------------------------------------------------
Profile process: 0.02194s 350% 3 * 0.00731s Profile oxNew: 0.01238s 197.42% 91 * 0.00014s Profile smarty_function_oxmultilang: 0.00831s 132.6% 12 * 0.00069s Profile _getLangTranslationArray: 0.0083s 132.4% 18 * 0.00046s Profile buildTree: 0.00776s 123.8% 1 * 0.00776s Profile _assignPriceInternal: 0.00616s 98.33% 2 * 0.00308s Profile _getAmountPrice: 0.0051s 81.35% 2 * 0.00255s Profile oxAutoload: 0.00405s 64.64% 82 * 5.0E-5s Profile generatePageNavigation: 0.00217s 34.61% 1 * 0.00217s Profile loadinglists: 0.00182s 29.1% 1 * 0.00182s Profile seoencoder_loadFromCache: 0.00095s 15.15% 17 * 6.0E-5s Profile articleAssign: 0.00052s 8.34% 2 * 0.00026s Profile executeMaintenanceTasks: 0.00025s 4.04% 1 * 0.00025s Profile fround: 4.0E-5s 0.67% 23 * 0s Profile _applyVAT: 3.0E-5s 0.41% 4 * 1.0E-5s Profile isSearchEngine: 2.0E-5s 0.29% 1 * 2.0E-5s Profile oxviewconfig::getViewConfigParam: 1.0E-5s 0.15% 6 * 0s Profile oxviewconfig::setViewConfigParam: 1.0E-5s 0.1% 5 * 0s Profile articleAssignParentInternal: 0s 0.06% 2 * 0s
cl=oxwservicelist(show/hide)
Memory usage: 3.573 MB (peak: 3.607 MB)
System memory usage: 2 MB (peak: 2 MB)
----------------------------------------------------------
System memory usage: 2 MB (peak: 2 MB)
Executed: 2024-05-24 08:52:37
Timestamp: 1716533557.8258
Execution time:0.002----------------------------------------------------------
| Profile process: | 0.06331s | 3167.19% | 12 | * | 0.00528s |
| Profile oxNew: | 0.01532s | 766.36% | 131 | * | 0.00012s |
| Profile smarty_function_oxmultilang: | 0.00874s | 437.4% | 54 | * | 0.00016s |
| Profile _getLangTranslationArray: | 0.00848s | 424.38% | 76 | * | 0.00011s |
| Profile buildTree: | 0.00776s | 388.26% | 1 | * | 0.00776s |
| Profile _assignPriceInternal: | 0.00616s | 308.37% | 2 | * | 0.00308s |
| Profile _getAmountPrice: | 0.0051s | 255.14% | 2 | * | 0.00255s |
| Profile oxAutoload: | 0.00473s | 236.72% | 95 | * | 5.0E-5s |
| Profile generatePageNavigation: | 0.00238s | 119.16% | 2 | * | 0.00119s |
| Profile loadinglists: | 0.00182s | 91.26% | 1 | * | 0.00182s |
| Profile seoencoder_loadFromCache: | 0.0013s | 64.95% | 47 | * | 3.0E-5s |
| Profile articleAssign: | 0.00052s | 26.16% | 2 | * | 0.00026s |
| Profile parseThroughSmarty: | 0.00028s | 13.86% | 1 | * | 0.00028s |
| Profile executeMaintenanceTasks: | 0.00025s | 12.67% | 1 | * | 0.00025s |
| Profile getCategoryUri: | 0.00025s | 12.5% | 14 | * | 2.0E-5s |
| Profile fround: | 4.0E-5s | 2.09% | 23 | * | 0s |
| Profile oxviewconfig::getViewConfigParam: | 3.0E-5s | 1.72% | 39 | * | 0s |
| Profile oxviewconfig::setViewConfigParam: | 3.0E-5s | 1.37% | 34 | * | 0s |
| Profile _applyVAT: | 3.0E-5s | 1.29% | 4 | * | 1.0E-5s |
| Profile isSearchEngine: | 2.0E-5s | 0.89% | 1 | * | 2.0E-5s |
| Profile articleAssignParentInternal: | 0s | 0.2% | 2 | * | 0s |
cl=oxwinformation(show/hide)
Memory usage: 3.689 MB (peak: 3.708 MB)
System memory usage: 2 MB (peak: 2 MB)
----------------------------------------------------------
System memory usage: 2 MB (peak: 2 MB)
Executed: 2024-05-24 08:52:37
Timestamp: 1716533557.8278
Execution time:0.0019----------------------------------------------------------
| Profile process: | 0.06519s | 3420.24% | 13 | * | 0.00501s |
| Profile oxNew: | 0.01561s | 819.08% | 136 | * | 0.00011s |
| Profile smarty_function_oxmultilang: | 0.00878s | 460.68% | 56 | * | 0.00016s |
| Profile _getLangTranslationArray: | 0.0085s | 445.72% | 79 | * | 0.00011s |
| Profile buildTree: | 0.00776s | 407.21% | 1 | * | 0.00776s |
| Profile _assignPriceInternal: | 0.00616s | 323.42% | 2 | * | 0.00308s |
| Profile _getAmountPrice: | 0.0051s | 267.59% | 2 | * | 0.00255s |
| Profile oxAutoload: | 0.00477s | 250.11% | 96 | * | 5.0E-5s |
| Profile generatePageNavigation: | 0.00238s | 124.97% | 2 | * | 0.00119s |
| Profile loadinglists: | 0.00182s | 95.71% | 1 | * | 0.00182s |
| Profile seoencoder_loadFromCache: | 0.00131s | 68.84% | 54 | * | 2.0E-5s |
| Profile articleAssign: | 0.00052s | 27.43% | 2 | * | 0.00026s |
| Profile parseThroughSmarty: | 0.00028s | 14.54% | 1 | * | 0.00028s |
| Profile executeMaintenanceTasks: | 0.00025s | 13.28% | 1 | * | 0.00025s |
| Profile getCategoryUri: | 0.00025s | 13.11% | 14 | * | 2.0E-5s |
| Profile fround: | 4.0E-5s | 2.19% | 23 | * | 0s |
| Profile oxviewconfig::getViewConfigParam: | 4.0E-5s | 1.91% | 40 | * | 0s |
| Profile oxviewconfig::setViewConfigParam: | 3.0E-5s | 1.54% | 36 | * | 0s |
| Profile _applyVAT: | 3.0E-5s | 1.35% | 4 | * | 1.0E-5s |
| Profile isSearchEngine: | 2.0E-5s | 0.94% | 1 | * | 2.0E-5s |
| Profile articleAssignParentInternal: | 0s | 0.21% | 2 | * | 0s |
cl=oxwmanufacturerlist(show/hide)
Memory usage: 3.747 MB (peak: 3.764 MB)
System memory usage: 4 MB (peak: 4 MB)
----------------------------------------------------------
System memory usage: 4 MB (peak: 4 MB)
Executed: 2024-05-24 08:52:37
Timestamp: 1716533557.8295
Execution time:0.0014----------------------------------------------------------
| Profile process: | 0.06656s | 4788.63% | 14 | * | 0.00475s |
| Profile oxNew: | 0.01592s | 1145.61% | 139 | * | 0.00011s |
| Profile smarty_function_oxmultilang: | 0.00881s | 633.79% | 58 | * | 0.00015s |
| Profile _getLangTranslationArray: | 0.00851s | 611.94% | 82 | * | 0.0001s |
| Profile buildTree: | 0.00776s | 558.35% | 1 | * | 0.00776s |
| Profile _assignPriceInternal: | 0.00616s | 443.46% | 2 | * | 0.00308s |
| Profile _getAmountPrice: | 0.0051s | 366.91% | 2 | * | 0.00255s |
| Profile oxAutoload: | 0.0048s | 345.54% | 97 | * | 5.0E-5s |
| Profile generatePageNavigation: | 0.00238s | 171.36% | 2 | * | 0.00119s |
| Profile loadinglists: | 0.00182s | 131.23% | 1 | * | 0.00182s |
| Profile seoencoder_loadFromCache: | 0.00133s | 95.42% | 66 | * | 2.0E-5s |
| Profile articleAssign: | 0.00052s | 37.62% | 2 | * | 0.00026s |
| Profile parseThroughSmarty: | 0.00028s | 19.93% | 1 | * | 0.00028s |
| Profile executeMaintenanceTasks: | 0.00025s | 18.22% | 1 | * | 0.00025s |
| Profile getCategoryUri: | 0.00025s | 17.98% | 14 | * | 2.0E-5s |
| Profile fround: | 4.0E-5s | 3% | 23 | * | 0s |
| Profile oxviewconfig::getViewConfigParam: | 4.0E-5s | 2.62% | 40 | * | 0s |
| Profile oxviewconfig::setViewConfigParam: | 3.0E-5s | 2.18% | 37 | * | 0s |
| Profile _applyVAT: | 3.0E-5s | 1.85% | 4 | * | 1.0E-5s |
| Profile isSearchEngine: | 2.0E-5s | 1.29% | 1 | * | 2.0E-5s |
| Profile articleAssignParentInternal: | 0s | 0.29% | 2 | * | 0s |
cl=oxwcategorytree(show/hide)
Memory usage: 3.774 MB (peak: 3.791 MB)
System memory usage: 4 MB (peak: 4 MB)
----------------------------------------------------------
System memory usage: 4 MB (peak: 4 MB)
Executed: 2024-05-24 08:52:37
Timestamp: 1716533557.8303
Execution time:0.0007----------------------------------------------------------
| Profile process: | 0.06726s | 9354.14% | 15 | * | 0.00448s |
| Profile oxNew: | 0.01594s | 2216.45% | 142 | * | 0.00011s |
| Profile smarty_function_oxmultilang: | 0.00883s | 1227.62% | 59 | * | 0.00015s |
| Profile _getLangTranslationArray: | 0.00851s | 1184.15% | 84 | * | 0.0001s |
| Profile buildTree: | 0.00776s | 1079.31% | 1 | * | 0.00776s |
| Profile _assignPriceInternal: | 0.00616s | 857.23% | 2 | * | 0.00308s |
| Profile _getAmountPrice: | 0.0051s | 709.25% | 2 | * | 0.00255s |
| Profile oxAutoload: | 0.0048s | 667.94% | 97 | * | 5.0E-5s |
| Profile generatePageNavigation: | 0.00238s | 331.23% | 2 | * | 0.00119s |
| Profile loadinglists: | 0.00182s | 253.68% | 1 | * | 0.00182s |
| Profile seoencoder_loadFromCache: | 0.00133s | 184.45% | 66 | * | 2.0E-5s |
| Profile articleAssign: | 0.00052s | 72.71% | 2 | * | 0.00026s |
| Profile parseThroughSmarty: | 0.00028s | 38.53% | 1 | * | 0.00028s |
| Profile executeMaintenanceTasks: | 0.00025s | 35.21% | 1 | * | 0.00025s |
| Profile getCategoryUri: | 0.00025s | 34.75% | 14 | * | 2.0E-5s |
| Profile fround: | 4.0E-5s | 5.8% | 23 | * | 0s |
| Profile oxviewconfig::getViewConfigParam: | 4.0E-5s | 5.07% | 40 | * | 0s |
| Profile oxviewconfig::setViewConfigParam: | 3.0E-5s | 4.21% | 38 | * | 0s |
| Profile _applyVAT: | 3.0E-5s | 3.58% | 4 | * | 1.0E-5s |
| Profile isSearchEngine: | 2.0E-5s | 2.49% | 1 | * | 2.0E-5s |
| Profile articleAssignParentInternal: | 0s | 0.56% | 2 | * | 0s |
oxidresponsive.com - Responsive Templates & Designs für OXID Onlineshops. Weitere Informationen, Preise & Bestellen