 Did you forget your password?
OXID Online Shop - All about watersports, sportswear and fashion
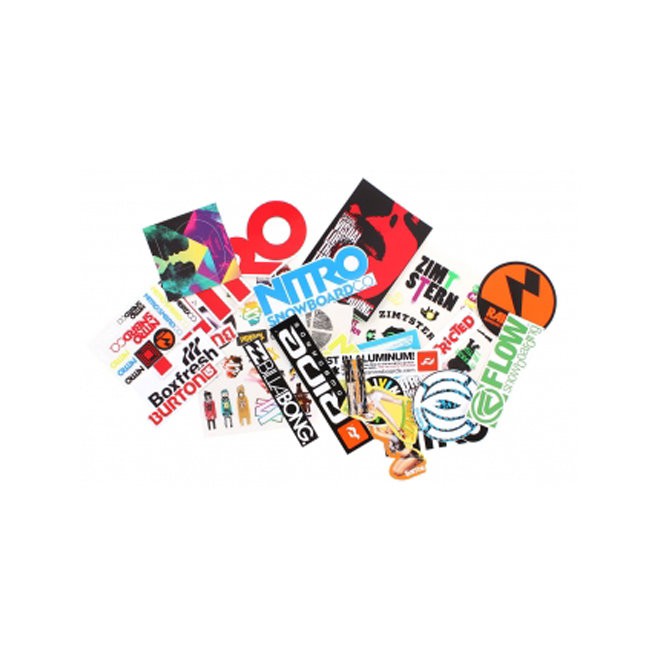
Sticker set MIX
Previous product
Product 2 of 2
Customers who bought this product also bought:
-
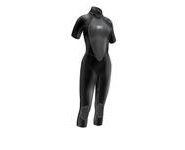
Wetsuit NPX VAMP
 cl=oxwarticlebox(show/hide)Memory usage: 3.701 MB (peak: 3.851 MB)
System memory usage: 4 MB (peak: 4 MB)Executed: 2024-06-09 16:21:14Timestamp: 1717942874.6216Execution time:0.0016
----------------------------------------------------------
Profile oxNew: 0.00841s 539.03% 125 * 7.0E-5s Profile oxAutoload: 0.00328s 210.45% 93 * 4.0E-5s Profile process: 0.00256s 164% 4 * 0.00064s Profile loadinglists: 0.00216s 138.23% 3 * 0.00072s Profile buildTree: 0.0019s 121.72% 1 * 0.0019s Profile articleAssign: 0.00063s 40.38% 8 * 8.0E-5s Profile getArticleUri: 0.0006s 38.17% 5 * 0.00012s Profile seoencoder_loadFromCache: 0.00054s 34.67% 26 * 2.0E-5s Profile _getAmountPrice: 0.00037s 23.38% 2 * 0.00018s Profile getArticleMainUri: 0.00015s 9.55% 1 * 0.00015s Profile executeMaintenanceTasks: 0.00014s 8.84% 1 * 0.00014s Profile smarty_function_oxmultilang: 0.00011s 6.8% 31 * 0s Profile _getLangTranslationArray: 0.0001s 6.2% 46 * 0s Profile _assignPriceInternal: 9.0E-5s 5.96% 2 * 5.0E-5s Profile getCategoryUri: 7.0E-5s 4.6% 2 * 4.0E-5s Profile fround: 2.0E-5s 1.21% 23 * 0s Profile oxviewconfig::getViewConfigParam: 1.0E-5s 0.41% 22 * 0s Profile isSearchEngine: 1.0E-5s 0.32% 1 * 1.0E-5s Profile articleAssignParentInternal: 0s 0.26% 8 * 0s Profile _applyVAT: 0s 0.18% 4 * 0s Profile oxviewconfig::setViewConfigParam: 0s 0.08% 12 * 0s -
Kiteboard CABRINHA CALIBER 2011
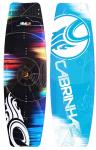 479,00 € * To cartcl=oxwarticlebox(show/hide)Memory usage: 3.733 MB (peak: 3.885 MB)
System memory usage: 4 MB (peak: 4 MB)Executed: 2024-06-09 16:21:14Timestamp: 1717942874.6231Execution time:0.0015
----------------------------------------------------------
Profile oxNew: 0.00843s 581.21% 132 * 6.0E-5s Profile process: 0.004s 276.18% 5 * 0.0008s Profile oxAutoload: 0.00328s 226.54% 93 * 4.0E-5s Profile loadinglists: 0.00216s 148.8% 3 * 0.00072s Profile buildTree: 0.0019s 131.03% 1 * 0.0019s Profile getArticleUri: 0.00126s 86.73% 6 * 0.00021s Profile articleAssign: 0.00063s 43.47% 8 * 8.0E-5s Profile seoencoder_loadFromCache: 0.00054s 37.39% 29 * 2.0E-5s Profile _getAmountPrice: 0.00043s 29.32% 3 * 0.00014s Profile getArticleMainUri: 0.00029s 19.86% 2 * 0.00014s Profile executeMaintenanceTasks: 0.00014s 9.52% 1 * 0.00014s Profile smarty_function_oxmultilang: 0.00011s 7.65% 33 * 0s Profile _getLangTranslationArray: 0.0001s 6.81% 49 * 0s Profile _assignPriceInternal: 0.0001s 6.63% 3 * 3.0E-5s Profile getCategoryUri: 7.0E-5s 4.95% 2 * 4.0E-5s Profile fround: 2.0E-5s 1.3% 29 * 0s Profile oxviewconfig::getViewConfigParam: 1.0E-5s 0.44% 23 * 0s Profile isSearchEngine: 1.0E-5s 0.35% 1 * 1.0E-5s Profile articleAssignParentInternal: 0s 0.28% 8 * 0s Profile _applyVAT: 0s 0.2% 6 * 0s Profile oxviewconfig::setViewConfigParam: 0s 0.08% 14 * 0s -
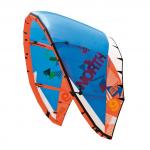
Kite NBK REBEL 2010
 799,00 € * To cartcl=oxwarticlebox(show/hide)Memory usage: 3.75 MB (peak: 3.901 MB)
System memory usage: 4 MB (peak: 4 MB)Executed: 2024-06-09 16:21:14Timestamp: 1717942874.6244Execution time:0.0012
----------------------------------------------------------
Profile oxNew: 0.00844s 679.93% 139 * 6.0E-5s Profile process: 0.00524s 422.22% 6 * 0.00087s Profile oxAutoload: 0.00328s 264.66% 93 * 4.0E-5s Profile loadinglists: 0.00216s 173.84% 3 * 0.00072s Profile buildTree: 0.0019s 153.07% 1 * 0.0019s Profile getArticleUri: 0.00171s 137.67% 7 * 0.00024s Profile articleAssign: 0.00063s 50.79% 8 * 8.0E-5s Profile seoencoder_loadFromCache: 0.00054s 43.85% 32 * 2.0E-5s Profile _getAmountPrice: 0.00049s 39.09% 4 * 0.00012s Profile getArticleMainUri: 0.00045s 35.86% 3 * 0.00015s Profile executeMaintenanceTasks: 0.00014s 11.12% 1 * 0.00014s Profile smarty_function_oxmultilang: 0.00012s 9.41% 35 * 0s Profile _getLangTranslationArray: 0.0001s 8.2% 52 * 0s Profile _assignPriceInternal: 0.0001s 7.97% 4 * 2.0E-5s Profile getCategoryUri: 7.0E-5s 5.78% 2 * 4.0E-5s Profile fround: 2.0E-5s 1.52% 35 * 0s Profile oxviewconfig::getViewConfigParam: 1.0E-5s 0.61% 24 * 0s Profile isSearchEngine: 1.0E-5s 0.4% 1 * 1.0E-5s Profile _applyVAT: 0s 0.38% 8 * 0s Profile articleAssignParentInternal: 0s 0.33% 8 * 0s Profile oxviewconfig::setViewConfigParam: 0s 0.1% 16 * 0s -
Harness SOL KITE
 cl=oxwarticlebox(show/hide)Memory usage: 3.783 MB (peak: 3.935 MB)
System memory usage: 4 MB (peak: 4 MB)Executed: 2024-06-09 16:21:14Timestamp: 1717942874.6256Execution time:0.0012
----------------------------------------------------------
Profile oxNew: 0.00845s 690.36% 146 * 6.0E-5s Profile process: 0.00646s 527.89% 7 * 0.00092s Profile oxAutoload: 0.00328s 268.37% 93 * 4.0E-5s Profile loadinglists: 0.00216s 176.28% 3 * 0.00072s Profile getArticleUri: 0.00215s 175.54% 8 * 0.00027s Profile buildTree: 0.0019s 155.22% 1 * 0.0019s Profile articleAssign: 0.00063s 51.5% 8 * 8.0E-5s Profile getArticleMainUri: 0.0006s 48.62% 4 * 0.00015s Profile seoencoder_loadFromCache: 0.00055s 44.62% 35 * 2.0E-5s Profile _getAmountPrice: 0.00054s 44.47% 5 * 0.00011s Profile executeMaintenanceTasks: 0.00014s 11.28% 1 * 0.00014s Profile smarty_function_oxmultilang: 0.00013s 10.28% 38 * 0s Profile _getLangTranslationArray: 0.0001s 8.55% 56 * 0s Profile _assignPriceInternal: 0.0001s 8.24% 5 * 2.0E-5s Profile getCategoryUri: 7.0E-5s 5.86% 2 * 4.0E-5s Profile fround: 2.0E-5s 1.54% 42 * 0s Profile oxviewconfig::getViewConfigParam: 1.0E-5s 0.7% 25 * 0s Profile _applyVAT: 1.0E-5s 0.49% 10 * 0s Profile isSearchEngine: 1.0E-5s 0.41% 1 * 1.0E-5s Profile articleAssignParentInternal: 0s 0.33% 8 * 0s Profile oxviewconfig::setViewConfigParam: 0s 0.1% 18 * 0s -
Kite NBK EVO 2010
 699,00 € * To cartcl=oxwarticlebox(show/hide)Memory usage: 3.815 MB (peak: 3.968 MB)
System memory usage: 4 MB (peak: 4 MB)Executed: 2024-06-09 16:21:14Timestamp: 1717942874.6269Execution time:0.0012
----------------------------------------------------------
Profile oxNew: 0.00846s 718.8% 153 * 6.0E-5s Profile process: 0.00763s 648.53% 8 * 0.00095s Profile oxAutoload: 0.00328s 279.08% 93 * 4.0E-5s Profile getArticleUri: 0.00253s 214.83% 9 * 0.00028s Profile loadinglists: 0.00216s 183.31% 3 * 0.00072s Profile buildTree: 0.0019s 161.41% 1 * 0.0019s Profile getArticleMainUri: 0.00073s 61.78% 5 * 0.00015s Profile articleAssign: 0.00063s 53.55% 8 * 8.0E-5s Profile _getAmountPrice: 0.0006s 50.84% 6 * 0.0001s Profile seoencoder_loadFromCache: 0.00055s 46.59% 38 * 1.0E-5s Profile executeMaintenanceTasks: 0.00014s 11.73% 1 * 0.00014s Profile smarty_function_oxmultilang: 0.00013s 11.3% 40 * 0s Profile _getLangTranslationArray: 0.00011s 9.22% 59 * 0s Profile _assignPriceInternal: 0.0001s 8.83% 6 * 2.0E-5s Profile getCategoryUri: 7.0E-5s 6.1% 2 * 4.0E-5s Profile fround: 2.0E-5s 1.7% 48 * 0s Profile oxviewconfig::getViewConfigParam: 1.0E-5s 0.73% 26 * 0s Profile _applyVAT: 1.0E-5s 0.59% 12 * 0s Profile isSearchEngine: 1.0E-5s 0.43% 1 * 1.0E-5s Profile articleAssignParentInternal: 0s 0.34% 8 * 0s Profile oxviewconfig::setViewConfigParam: 0s 0.2% 20 * 0s
cl=oxwarticledetails(show/hide)
Memory usage: 3.897 MB (peak: 4.092 MB)
System memory usage: 4 MB (peak: 4 MB)
----------------------------------------------------------
System memory usage: 4 MB (peak: 4 MB)
Executed: 2024-06-09 16:21:14
Timestamp: 1717942874.6298
Execution time:0.0029----------------------------------------------------------
| Profile process: | 0.01177s | 402.39% | 9 | * | 0.00131s |
| Profile oxNew: | 0.00883s | 301.94% | 163 | * | 5.0E-5s |
| Profile oxAutoload: | 0.00337s | 115.18% | 95 | * | 4.0E-5s |
| Profile loadinglists: | 0.00321s | 109.78% | 5 | * | 0.00064s |
| Profile getArticleUri: | 0.00253s | 86.48% | 9 | * | 0.00028s |
| Profile buildTree: | 0.0019s | 64.98% | 1 | * | 0.0019s |
| Profile getArticleMainUri: | 0.00073s | 24.87% | 5 | * | 0.00015s |
| Profile articleAssign: | 0.00063s | 21.56% | 8 | * | 8.0E-5s |
| Profile _getAmountPrice: | 0.0006s | 20.47% | 6 | * | 0.0001s |
| Profile seoencoder_loadFromCache: | 0.00055s | 18.75% | 38 | * | 1.0E-5s |
| Profile smarty_function_oxmultilang: | 0.00015s | 4.97% | 43 | * | 0s |
| Profile executeMaintenanceTasks: | 0.00014s | 4.72% | 1 | * | 0.00014s |
| Profile _getLangTranslationArray: | 0.00012s | 3.98% | 65 | * | 0s |
| Profile _assignPriceInternal: | 0.0001s | 3.56% | 6 | * | 2.0E-5s |
| Profile getCategoryUri: | 7.0E-5s | 2.45% | 2 | * | 4.0E-5s |
| Profile fround: | 2.0E-5s | 0.68% | 48 | * | 0s |
| Profile oxviewconfig::getViewConfigParam: | 1.0E-5s | 0.29% | 28 | * | 0s |
| Profile _applyVAT: | 1.0E-5s | 0.24% | 12 | * | 0s |
| Profile isSearchEngine: | 1.0E-5s | 0.17% | 1 | * | 1.0E-5s |
| Profile articleAssignParentInternal: | 0s | 0.14% | 8 | * | 0s |
| Profile oxviewconfig::setViewConfigParam: | 0s | 0.08% | 23 | * | 0s |