 Sie haben Ihr Passwort vergessen?
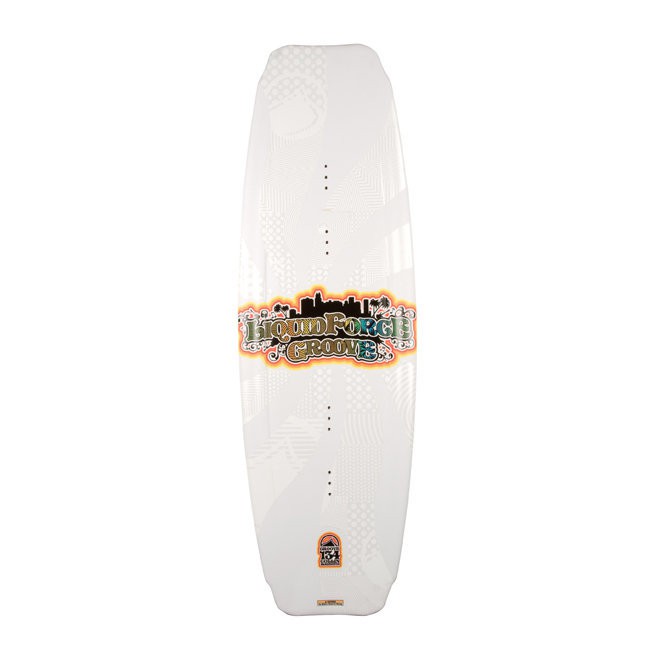
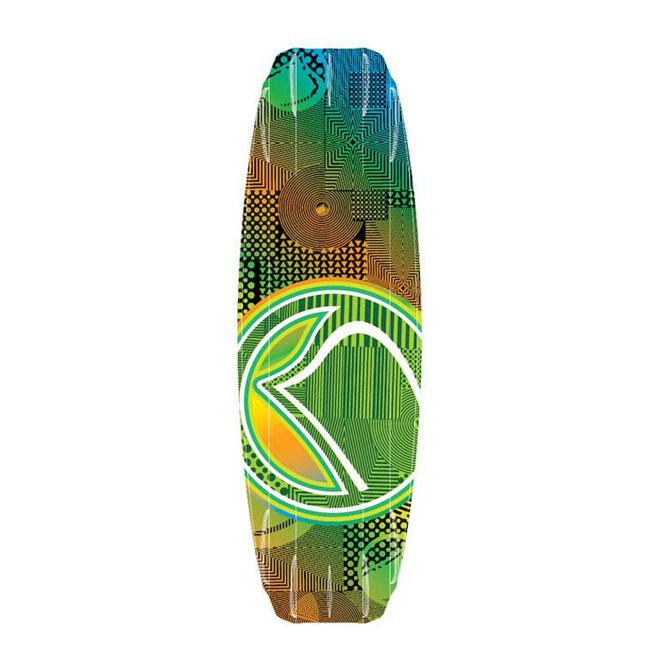
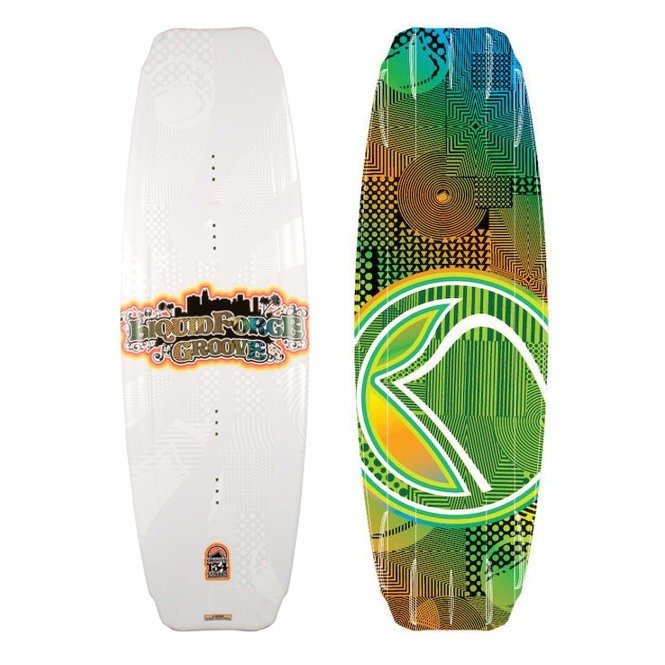
Wakeboard LIQUID FORCE GROOVE 2010


Kunden, die diesen Artikel gekauft haben, kauften auch:
-
Trapez ION SOL KITE 2011
 cl=oxwarticlebox(show/hide)Memory usage: 4.255 MB (peak: 4.407 MB)
System memory usage: 4 MB (peak: 4 MB)Executed: 2024-05-28 06:00:20Timestamp: 1716868820.2302Execution time:0.0016
----------------------------------------------------------
Profile oxNew: 0.01012s 614.99% 128 * 8.0E-5s Profile oxAutoload: 0.00366s 222.07% 93 * 4.0E-5s Profile loadinglists: 0.00284s 172.52% 2 * 0.00142s Profile process: 0.0028s 169.97% 4 * 0.0007s Profile buildTree: 0.00163s 99.2% 1 * 0.00163s Profile articleAssign: 0.00159s 96.7% 16 * 0.0001s Profile getArticleUri: 0.0006s 36.46% 7 * 9.0E-5s Profile seoencoder_loadFromCache: 0.00055s 33.6% 30 * 2.0E-5s Profile _getAmountPrice: 0.00043s 26.25% 2 * 0.00022s Profile articleAssignParentInternal: 0.00022s 13.48% 16 * 1.0E-5s Profile executeMaintenanceTasks: 0.00018s 10.88% 1 * 0.00018s Profile getCategoryUri: 0.00017s 10.14% 2 * 8.0E-5s Profile _assignPriceInternal: 0.00016s 9.97% 2 * 8.0E-5s Profile getArticleMainUri: 0.00015s 8.99% 1 * 0.00015s Profile smarty_function_oxmultilang: 0.00014s 8.81% 33 * 0s Profile _getLangTranslationArray: 0.00012s 7.1% 50 * 0s Profile fround: 1.0E-5s 0.72% 24 * 0s Profile _applyVAT: 1.0E-5s 0.41% 4 * 0s Profile isSearchEngine: 1.0E-5s 0.36% 1 * 1.0E-5s Profile oxviewconfig::getViewConfigParam: 1.0E-5s 0.35% 22 * 0s Profile oxviewconfig::setViewConfigParam: 0s 0.06% 12 * 0s -
Kite CORE GTS
 cl=oxwarticlebox(show/hide)Memory usage: 4.288 MB (peak: 4.439 MB)
System memory usage: 4 MB (peak: 4 MB)Executed: 2024-05-28 06:00:20Timestamp: 1716868820.2316Execution time:0.0013
----------------------------------------------------------
Profile oxNew: 0.01013s 767.64% 135 * 8.0E-5s Profile process: 0.00411s 311.54% 5 * 0.00082s Profile oxAutoload: 0.00366s 276.9% 93 * 4.0E-5s Profile loadinglists: 0.00284s 215.12% 2 * 0.00142s Profile buildTree: 0.00163s 123.7% 1 * 0.00163s Profile articleAssign: 0.00159s 120.57% 16 * 0.0001s Profile getArticleUri: 0.00104s 78.78% 8 * 0.00013s Profile seoencoder_loadFromCache: 0.00056s 42.04% 33 * 2.0E-5s Profile _getAmountPrice: 0.0005s 37.66% 3 * 0.00017s Profile getArticleMainUri: 0.00035s 26.82% 2 * 0.00018s Profile articleAssignParentInternal: 0.00022s 16.81% 16 * 1.0E-5s Profile executeMaintenanceTasks: 0.00018s 13.56% 1 * 0.00018s Profile _assignPriceInternal: 0.00017s 12.73% 3 * 6.0E-5s Profile getCategoryUri: 0.00017s 12.64% 2 * 8.0E-5s Profile smarty_function_oxmultilang: 0.00015s 11.63% 36 * 0s Profile _getLangTranslationArray: 0.00012s 9.14% 54 * 0s Profile fround: 1.0E-5s 0.99% 31 * 0s Profile _applyVAT: 1.0E-5s 0.58% 6 * 0s Profile isSearchEngine: 1.0E-5s 0.45% 1 * 1.0E-5s Profile oxviewconfig::getViewConfigParam: 1.0E-5s 0.43% 23 * 0s Profile oxviewconfig::setViewConfigParam: 0s 0.07% 14 * 0s -
Transportcontainer THE BARREL
 24,95 € * In den Warenkorbcl=oxwarticlebox(show/hide)Memory usage: 4.32 MB (peak: 4.472 MB)
System memory usage: 4 MB (peak: 4 MB)Executed: 2024-05-28 06:00:20Timestamp: 1716868820.2336Execution time:0.002
----------------------------------------------------------
Profile oxNew: 0.01016s 496.9% 142 * 7.0E-5s Profile process: 0.00615s 300.82% 6 * 0.00102s Profile oxAutoload: 0.00366s 178.84% 93 * 4.0E-5s Profile loadinglists: 0.00284s 138.94% 2 * 0.00142s Profile getArticleUri: 0.00186s 91.15% 9 * 0.00021s Profile buildTree: 0.00163s 79.89% 1 * 0.00163s Profile articleAssign: 0.00159s 77.87% 16 * 0.0001s Profile getArticleMainUri: 0.00067s 32.84% 3 * 0.00022s Profile _getAmountPrice: 0.00064s 31.07% 4 * 0.00016s Profile seoencoder_loadFromCache: 0.00056s 27.34% 36 * 2.0E-5s Profile articleAssignParentInternal: 0.00022s 10.86% 16 * 1.0E-5s Profile executeMaintenanceTasks: 0.00018s 8.76% 1 * 0.00018s Profile _assignPriceInternal: 0.00017s 8.52% 4 * 4.0E-5s Profile getCategoryUri: 0.00017s 8.17% 2 * 8.0E-5s Profile smarty_function_oxmultilang: 0.00016s 8.05% 38 * 0s Profile _getLangTranslationArray: 0.00013s 6.16% 57 * 0s Profile fround: 2.0E-5s 0.73% 37 * 0s Profile _applyVAT: 1.0E-5s 0.51% 8 * 0s Profile oxviewconfig::getViewConfigParam: 1.0E-5s 0.33% 24 * 0s Profile isSearchEngine: 1.0E-5s 0.29% 1 * 1.0E-5s Profile oxviewconfig::setViewConfigParam: 0s 0.05% 16 * 0s -
Stewart+Brown Lace Scoop Neck Tee XS | Nocturne
(2)_th.jpg) 59,90 € * In den Warenkorbcl=oxwarticlebox(show/hide)Memory usage: 4.353 MB (peak: 4.488 MB)
59,90 € * In den Warenkorbcl=oxwarticlebox(show/hide)Memory usage: 4.353 MB (peak: 4.488 MB)
System memory usage: 4 MB (peak: 4 MB)Executed: 2024-05-28 06:00:20Timestamp: 1716868820.236Execution time:0.0023
----------------------------------------------------------
Profile oxNew: 0.01018s 444.92% 149 * 7.0E-5s Profile process: 0.00843s 368.45% 7 * 0.0012s Profile oxAutoload: 0.00366s 159.77% 93 * 4.0E-5s Profile loadinglists: 0.00284s 124.12% 2 * 0.00142s Profile getArticleUri: 0.00267s 116.83% 10 * 0.00027s Profile buildTree: 0.00163s 71.37% 1 * 0.00163s Profile articleAssign: 0.00159s 69.57% 16 * 0.0001s Profile getArticleMainUri: 0.00094s 40.87% 4 * 0.00023s Profile _getAmountPrice: 0.00076s 33.4% 5 * 0.00015s Profile seoencoder_loadFromCache: 0.00056s 24.57% 39 * 1.0E-5s Profile articleAssignParentInternal: 0.00022s 9.7% 16 * 1.0E-5s Profile _assignPriceInternal: 0.00018s 7.87% 5 * 4.0E-5s Profile executeMaintenanceTasks: 0.00018s 7.83% 1 * 0.00018s Profile smarty_function_oxmultilang: 0.00017s 7.63% 40 * 0s Profile getCategoryUri: 0.00017s 7.29% 2 * 8.0E-5s Profile _getLangTranslationArray: 0.00013s 5.67% 60 * 0s Profile fround: 2.0E-5s 0.79% 43 * 0s Profile _applyVAT: 1.0E-5s 0.54% 10 * 0s Profile oxviewconfig::getViewConfigParam: 1.0E-5s 0.29% 25 * 0s Profile isSearchEngine: 1.0E-5s 0.26% 1 * 1.0E-5s Profile oxviewconfig::setViewConfigParam: 0s 0.08% 18 * 0s -
Kite NBK REBEL 2010
 799,00 € * In den Warenkorbcl=oxwarticlebox(show/hide)Memory usage: 4.369 MB (peak: 4.521 MB)
System memory usage: 4 MB (peak: 4 MB)Executed: 2024-05-28 06:00:20Timestamp: 1716868820.238Execution time:0.002
----------------------------------------------------------
Profile process: 0.01039s 528.4% 8 * 0.0013s Profile oxNew: 0.0102s 518.8% 156 * 7.0E-5s Profile oxAutoload: 0.00366s 185.93% 93 * 4.0E-5s Profile getArticleUri: 0.00334s 169.99% 11 * 0.0003s Profile loadinglists: 0.00284s 144.45% 2 * 0.00142s Profile buildTree: 0.00163s 83.06% 1 * 0.00163s Profile articleAssign: 0.00159s 80.96% 16 * 0.0001s Profile getArticleMainUri: 0.00112s 56.82% 5 * 0.00022s Profile _getAmountPrice: 0.00084s 42.93% 6 * 0.00014s Profile seoencoder_loadFromCache: 0.00057s 28.8% 42 * 1.0E-5s Profile articleAssignParentInternal: 0.00022s 11.29% 16 * 1.0E-5s Profile _assignPriceInternal: 0.00019s 9.41% 6 * 3.0E-5s Profile smarty_function_oxmultilang: 0.00018s 9.39% 42 * 0s Profile executeMaintenanceTasks: 0.00018s 9.11% 1 * 0.00018s Profile getCategoryUri: 0.00017s 8.49% 2 * 8.0E-5s Profile _getLangTranslationArray: 0.00013s 6.82% 63 * 0s Profile fround: 2.0E-5s 0.92% 49 * 0s Profile _applyVAT: 1.0E-5s 0.73% 12 * 0s Profile oxviewconfig::getViewConfigParam: 1.0E-5s 0.34% 26 * 0s Profile isSearchEngine: 1.0E-5s 0.3% 1 * 1.0E-5s Profile oxviewconfig::setViewConfigParam: 0s 0.19% 20 * 0s
Schon gesehen?
-

-
Wakeboard LIQUID FORCE S4 2010
389,00 € * -
Wakeboard LIQUID FORCE SHANE 2010
389,00 € * -
Bindung O'BRIEN DECADE CT 2010
359,00 € * -
Bindung LIQUID FORCE INDEX BOOT 2010
159,00 € * -
Helm AHM 5000
45,00 € *
cl=oxwarticlebox(show/hide)
Memory usage: 4.515 MB (peak: 4.613 MB)
System memory usage: 4 MB (peak: 4 MB)
----------------------------------------------------------
System memory usage: 4 MB (peak: 4 MB)
Executed: 2024-05-28 06:00:20
Timestamp: 1716868820.2428
Execution time:0.0014----------------------------------------------------------
| Profile process: | 0.01395s | 967.82% | 10 | * | 0.00139s |
| Profile oxNew: | 0.01094s | 758.9% | 167 | * | 7.0E-5s |
| Profile oxAutoload: | 0.0038s | 263.86% | 95 | * | 4.0E-5s |
| Profile getArticleUri: | 0.00334s | 231.92% | 11 | * | 0.0003s |
| Profile loadinglists: | 0.00284s | 197.07% | 2 | * | 0.00142s |
| Profile buildTree: | 0.00163s | 113.32% | 1 | * | 0.00163s |
| Profile articleAssign: | 0.00159s | 110.46% | 16 | * | 0.0001s |
| Profile getArticleMainUri: | 0.00138s | 95.91% | 6 | * | 0.00023s |
| Profile _getAmountPrice: | 0.00101s | 70.23% | 7 | * | 0.00014s |
| Profile seoencoder_loadFromCache: | 0.00057s | 39.59% | 44 | * | 1.0E-5s |
| Profile articleAssignParentInternal: | 0.00022s | 15.4% | 16 | * | 1.0E-5s |
| Profile smarty_function_oxmultilang: | 0.00021s | 14.48% | 46 | * | 0s |
| Profile _assignPriceInternal: | 0.00019s | 13.25% | 7 | * | 3.0E-5s |
| Profile executeMaintenanceTasks: | 0.00018s | 12.43% | 1 | * | 0.00018s |
| Profile getCategoryUri: | 0.00017s | 11.58% | 2 | * | 8.0E-5s |
| Profile _getLangTranslationArray: | 0.00015s | 10.16% | 69 | * | 0s |
| Profile fround: | 2.0E-5s | 1.46% | 52 | * | 0s |
| Profile _applyVAT: | 2.0E-5s | 1.13% | 13 | * | 0s |
| Profile oxviewconfig::getViewConfigParam: | 1.0E-5s | 0.46% | 29 | * | 0s |
| Profile isSearchEngine: | 1.0E-5s | 0.41% | 1 | * | 1.0E-5s |
| Profile oxviewconfig::setViewConfigParam: | 1.0E-5s | 0.41% | 24 | * | 0s |

cl=oxwarticlebox(show/hide)
Memory usage: 4.529 MB (peak: 4.628 MB)
System memory usage: 4 MB (peak: 4 MB)
----------------------------------------------------------
System memory usage: 4 MB (peak: 4 MB)
Executed: 2024-05-28 06:00:20
Timestamp: 1716868820.2441
Execution time:0.0012----------------------------------------------------------
| Profile process: | 0.01517s | 1234.14% | 11 | * | 0.00138s |
| Profile oxNew: | 0.01096s | 891.43% | 173 | * | 6.0E-5s |
| Profile oxAutoload: | 0.0038s | 309.37% | 95 | * | 4.0E-5s |
| Profile getArticleUri: | 0.00334s | 271.91% | 11 | * | 0.0003s |
| Profile loadinglists: | 0.00284s | 231.06% | 2 | * | 0.00142s |
| Profile buildTree: | 0.00163s | 132.86% | 1 | * | 0.00163s |
| Profile getArticleMainUri: | 0.0016s | 130.11% | 7 | * | 0.00023s |
| Profile articleAssign: | 0.00159s | 129.51% | 16 | * | 0.0001s |
| Profile _getAmountPrice: | 0.00115s | 93.66% | 8 | * | 0.00014s |
| Profile seoencoder_loadFromCache: | 0.00057s | 46.65% | 46 | * | 1.0E-5s |
| Profile articleAssignParentInternal: | 0.00022s | 18.06% | 16 | * | 1.0E-5s |
| Profile smarty_function_oxmultilang: | 0.00021s | 16.97% | 46 | * | 0s |
| Profile _assignPriceInternal: | 0.0002s | 16.02% | 8 | * | 2.0E-5s |
| Profile executeMaintenanceTasks: | 0.00018s | 14.57% | 1 | * | 0.00018s |
| Profile getCategoryUri: | 0.00017s | 13.58% | 2 | * | 8.0E-5s |
| Profile _getLangTranslationArray: | 0.00015s | 12.07% | 70 | * | 0s |
| Profile fround: | 2.0E-5s | 1.86% | 55 | * | 0s |
| Profile _applyVAT: | 2.0E-5s | 1.42% | 14 | * | 0s |
| Profile oxviewconfig::getViewConfigParam: | 1.0E-5s | 0.54% | 30 | * | 0s |
| Profile isSearchEngine: | 1.0E-5s | 0.48% | 1 | * | 1.0E-5s |
| Profile oxviewconfig::setViewConfigParam: | 1.0E-5s | 0.48% | 26 | * | 0s |

cl=oxwarticlebox(show/hide)
Memory usage: 4.561 MB (peak: 4.659 MB)
System memory usage: 4 MB (peak: 4 MB)
----------------------------------------------------------
System memory usage: 4 MB (peak: 4 MB)
Executed: 2024-05-28 06:00:20
Timestamp: 1716868820.2453
Execution time:0.0012----------------------------------------------------------
| Profile process: | 0.01632s | 1412.84% | 12 | * | 0.00136s |
| Profile oxNew: | 0.01097s | 949.82% | 179 | * | 6.0E-5s |
| Profile oxAutoload: | 0.0038s | 329.16% | 95 | * | 4.0E-5s |
| Profile getArticleUri: | 0.00334s | 289.31% | 11 | * | 0.0003s |
| Profile loadinglists: | 0.00284s | 245.84% | 2 | * | 0.00142s |
| Profile getArticleMainUri: | 0.00185s | 160.17% | 8 | * | 0.00023s |
| Profile buildTree: | 0.00163s | 141.36% | 1 | * | 0.00163s |
| Profile articleAssign: | 0.00159s | 137.79% | 16 | * | 0.0001s |
| Profile _getAmountPrice: | 0.00124s | 107.18% | 9 | * | 0.00014s |
| Profile seoencoder_loadFromCache: | 0.00058s | 49.8% | 48 | * | 1.0E-5s |
| Profile articleAssignParentInternal: | 0.00022s | 19.22% | 16 | * | 1.0E-5s |
| Profile smarty_function_oxmultilang: | 0.00021s | 18.06% | 46 | * | 0s |
| Profile _assignPriceInternal: | 0.0002s | 17.4% | 9 | * | 2.0E-5s |
| Profile executeMaintenanceTasks: | 0.00018s | 15.5% | 1 | * | 0.00018s |
| Profile getCategoryUri: | 0.00017s | 14.45% | 2 | * | 8.0E-5s |
| Profile _getLangTranslationArray: | 0.00015s | 12.92% | 71 | * | 0s |
| Profile fround: | 2.0E-5s | 1.98% | 58 | * | 0s |
| Profile _applyVAT: | 2.0E-5s | 1.59% | 15 | * | 0s |
| Profile oxviewconfig::getViewConfigParam: | 1.0E-5s | 0.58% | 31 | * | 0s |
| Profile isSearchEngine: | 1.0E-5s | 0.52% | 1 | * | 1.0E-5s |
| Profile oxviewconfig::setViewConfigParam: | 1.0E-5s | 0.52% | 28 | * | 0s |

cl=oxwarticlebox(show/hide)
Memory usage: 4.591 MB (peak: 4.689 MB)
System memory usage: 4 MB (peak: 4 MB)
----------------------------------------------------------
System memory usage: 4 MB (peak: 4 MB)
Executed: 2024-05-28 06:00:20
Timestamp: 1716868820.2462
Execution time:0.0009----------------------------------------------------------
| Profile process: | 0.01718s | 1981.71% | 13 | * | 0.00132s |
| Profile oxNew: | 0.01099s | 1267.41% | 185 | * | 6.0E-5s |
| Profile oxAutoload: | 0.0038s | 438.61% | 95 | * | 4.0E-5s |
| Profile getArticleUri: | 0.00334s | 385.51% | 11 | * | 0.0003s |
| Profile loadinglists: | 0.00284s | 327.59% | 2 | * | 0.00142s |
| Profile getArticleMainUri: | 0.00205s | 235.92% | 9 | * | 0.00023s |
| Profile buildTree: | 0.00163s | 188.37% | 1 | * | 0.00163s |
| Profile articleAssign: | 0.00159s | 183.61% | 16 | * | 0.0001s |
| Profile _getAmountPrice: | 0.00137s | 158.28% | 10 | * | 0.00014s |
| Profile seoencoder_loadFromCache: | 0.00058s | 66.58% | 50 | * | 1.0E-5s |
| Profile articleAssignParentInternal: | 0.00022s | 25.61% | 16 | * | 1.0E-5s |
| Profile _assignPriceInternal: | 0.00021s | 24.09% | 10 | * | 2.0E-5s |
| Profile smarty_function_oxmultilang: | 0.00021s | 24.06% | 46 | * | 0s |
| Profile executeMaintenanceTasks: | 0.00018s | 20.65% | 1 | * | 0.00018s |
| Profile getCategoryUri: | 0.00017s | 19.25% | 2 | * | 8.0E-5s |
| Profile _getLangTranslationArray: | 0.00015s | 17.57% | 72 | * | 0s |
| Profile fround: | 2.0E-5s | 2.75% | 61 | * | 0s |
| Profile _applyVAT: | 2.0E-5s | 2.34% | 16 | * | 0s |
| Profile oxviewconfig::getViewConfigParam: | 1.0E-5s | 0.77% | 32 | * | 0s |
| Profile isSearchEngine: | 1.0E-5s | 0.69% | 1 | * | 1.0E-5s |
| Profile oxviewconfig::setViewConfigParam: | 1.0E-5s | 0.69% | 30 | * | 0s |

cl=oxwarticlebox(show/hide)
Memory usage: 4.606 MB (peak: 4.705 MB)
System memory usage: 4 MB (peak: 4 MB)
----------------------------------------------------------
System memory usage: 4 MB (peak: 4 MB)
Executed: 2024-05-28 06:00:20
Timestamp: 1716868820.2475
Execution time:0.0013----------------------------------------------------------
| Profile process: | 0.01845s | 1438.36% | 14 | * | 0.00132s |
| Profile oxNew: | 0.01101s | 858.06% | 191 | * | 6.0E-5s |
| Profile oxAutoload: | 0.0038s | 296.38% | 95 | * | 4.0E-5s |
| Profile getArticleUri: | 0.00334s | 260.49% | 11 | * | 0.0003s |
| Profile loadinglists: | 0.00284s | 221.35% | 2 | * | 0.00142s |
| Profile getArticleMainUri: | 0.00228s | 177.79% | 10 | * | 0.00023s |
| Profile buildTree: | 0.00163s | 127.28% | 1 | * | 0.00163s |
| Profile articleAssign: | 0.00159s | 124.07% | 16 | * | 0.0001s |
| Profile _getAmountPrice: | 0.0015s | 116.61% | 11 | * | 0.00014s |
| Profile seoencoder_loadFromCache: | 0.00058s | 45.14% | 52 | * | 1.0E-5s |
| Profile articleAssignParentInternal: | 0.00022s | 17.3% | 16 | * | 1.0E-5s |
| Profile _assignPriceInternal: | 0.00022s | 16.99% | 11 | * | 2.0E-5s |
| Profile smarty_function_oxmultilang: | 0.00021s | 16.26% | 46 | * | 0s |
| Profile executeMaintenanceTasks: | 0.00018s | 13.96% | 1 | * | 0.00018s |
| Profile getCategoryUri: | 0.00017s | 13.01% | 2 | * | 8.0E-5s |
| Profile _getLangTranslationArray: | 0.00016s | 12.1% | 73 | * | 0s |
| Profile fround: | 2.0E-5s | 1.93% | 64 | * | 0s |
| Profile _applyVAT: | 2.0E-5s | 1.65% | 17 | * | 0s |
| Profile oxviewconfig::setViewConfigParam: | 1.0E-5s | 0.54% | 32 | * | 0s |
| Profile oxviewconfig::getViewConfigParam: | 1.0E-5s | 0.52% | 33 | * | 0s |
| Profile isSearchEngine: | 1.0E-5s | 0.46% | 1 | * | 1.0E-5s |
cl=oxwarticledetails(show/hide)
Memory usage: 4.7 MB (peak: 5.029 MB)
System memory usage: 4 MB (peak: 4 MB)
----------------------------------------------------------
System memory usage: 4 MB (peak: 4 MB)
Executed: 2024-05-28 06:00:20
Timestamp: 1716868820.2489
Execution time:0.0026----------------------------------------------------------
| Profile process: | 0.02104s | 810.77% | 14 | * | 0.0015s |
| Profile oxNew: | 0.01102s | 424.72% | 194 | * | 6.0E-5s |
| Profile oxAutoload: | 0.0038s | 146.53% | 95 | * | 4.0E-5s |
| Profile getArticleUri: | 0.00334s | 128.79% | 11 | * | 0.0003s |
| Profile loadinglists: | 0.0033s | 127.17% | 3 | * | 0.0011s |
| Profile getArticleMainUri: | 0.00228s | 87.9% | 10 | * | 0.00023s |
| Profile buildTree: | 0.00163s | 62.93% | 1 | * | 0.00163s |
| Profile articleAssign: | 0.00159s | 61.34% | 16 | * | 0.0001s |
| Profile _getAmountPrice: | 0.0015s | 57.65% | 11 | * | 0.00014s |
| Profile seoencoder_loadFromCache: | 0.00058s | 22.32% | 52 | * | 1.0E-5s |
| Profile articleAssignParentInternal: | 0.00022s | 8.55% | 16 | * | 1.0E-5s |
| Profile _assignPriceInternal: | 0.00022s | 8.4% | 11 | * | 2.0E-5s |
| Profile smarty_function_oxmultilang: | 0.00021s | 8.04% | 46 | * | 0s |
| Profile executeMaintenanceTasks: | 0.00018s | 6.9% | 1 | * | 0.00018s |
| Profile getCategoryUri: | 0.00017s | 6.43% | 2 | * | 8.0E-5s |
| Profile _getLangTranslationArray: | 0.00016s | 6.21% | 75 | * | 0s |
| Profile fround: | 2.0E-5s | 0.96% | 64 | * | 0s |
| Profile _applyVAT: | 2.0E-5s | 0.82% | 17 | * | 0s |
| Profile oxviewconfig::setViewConfigParam: | 1.0E-5s | 0.27% | 32 | * | 0s |
| Profile oxviewconfig::getViewConfigParam: | 1.0E-5s | 0.26% | 33 | * | 0s |
| Profile isSearchEngine: | 1.0E-5s | 0.23% | 1 | * | 1.0E-5s |