 Sie haben Ihr Passwort vergessen?
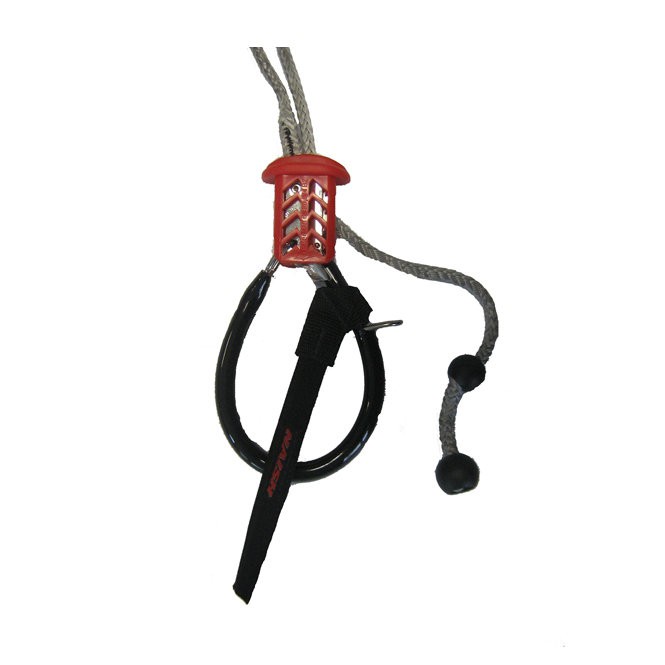
Smart Loop NAISH
Schon gesehen?
-

-
Trapez ION SOL KITE 2011
129,00 € * -
Trapez ION MADTRIXX
159,00 € * -
Kite Leinen VECTOR QUAD PRO
35,50 € *
cl=oxwarticlebox(show/hide)
Memory usage: 3.455 MB (peak: 3.504 MB)
System memory usage: 2 MB (peak: 2 MB)
----------------------------------------------------------
System memory usage: 2 MB (peak: 2 MB)
Executed: 2024-05-10 20:32:38
Timestamp: 1715365958.3219
Execution time:0.0014----------------------------------------------------------
| Profile oxNew: | 0.0113s | 800.71% | 131 | * | 9.0E-5s |
| Profile oxAutoload: | 0.00425s | 301.52% | 94 | * | 5.0E-5s |
| Profile process: | 0.00417s | 295.4% | 5 | * | 0.00083s |
| Profile loadinglists: | 0.00215s | 152.1% | 2 | * | 0.00107s |
| Profile buildTree: | 0.00185s | 131.06% | 1 | * | 0.00185s |
| Profile articleAssign: | 0.00095s | 67.05% | 8 | * | 0.00012s |
| Profile _getAmountPrice: | 0.00071s | 50.39% | 2 | * | 0.00036s |
| Profile getCategory: | 0.00056s | 39.9% | 2 | * | 0.00028s |
| Profile seoencoder_loadFromCache: | 0.00055s | 38.8% | 29 | * | 2.0E-5s |
| Profile getArticleManufacturerUri: | 0.00037s | 26.21% | 6 | * | 6.0E-5s |
| Profile getArticleMainUri: | 0.00032s | 22.9% | 1 | * | 0.00032s |
| Profile smarty_function_oxmultilang: | 0.0002s | 14.3% | 33 | * | 1.0E-5s |
| Profile _getLangTranslationArray: | 0.00017s | 11.93% | 48 | * | 0s |
| Profile _assignPriceInternal: | 0.00016s | 11.61% | 2 | * | 8.0E-5s |
| Profile executeMaintenanceTasks: | 0.00016s | 11.54% | 1 | * | 0.00016s |
| Profile fround: | 2.0E-5s | 1.44% | 19 | * | 0s |
| Profile articleAssignParentInternal: | 1.0E-5s | 0.73% | 8 | * | 0s |
| Profile oxviewconfig::getViewConfigParam: | 1.0E-5s | 0.61% | 24 | * | 0s |
| Profile isSearchEngine: | 1.0E-5s | 0.42% | 1 | * | 1.0E-5s |
| Profile _applyVAT: | 1.0E-5s | 0.42% | 3 | * | 0s |
| Profile oxviewconfig::setViewConfigParam: | 0s | 0.27% | 15 | * | 0s |

cl=oxwarticlebox(show/hide)
Memory usage: 3.471 MB (peak: 3.519 MB)
System memory usage: 2 MB (peak: 2 MB)
----------------------------------------------------------
System memory usage: 2 MB (peak: 2 MB)
Executed: 2024-05-10 20:32:38
Timestamp: 1715365958.3231
Execution time:0.0011----------------------------------------------------------
| Profile oxNew: | 0.01132s | 1014.21% | 137 | * | 8.0E-5s |
| Profile process: | 0.00528s | 472.76% | 6 | * | 0.00088s |
| Profile oxAutoload: | 0.00425s | 381.2% | 94 | * | 5.0E-5s |
| Profile loadinglists: | 0.00215s | 192.29% | 2 | * | 0.00107s |
| Profile buildTree: | 0.00185s | 165.69% | 1 | * | 0.00185s |
| Profile articleAssign: | 0.00095s | 84.77% | 8 | * | 0.00012s |
| Profile _getAmountPrice: | 0.00085s | 75.99% | 3 | * | 0.00028s |
| Profile getArticleMainUri: | 0.00063s | 56.18% | 2 | * | 0.00031s |
| Profile getCategory: | 0.00056s | 50.44% | 2 | * | 0.00028s |
| Profile seoencoder_loadFromCache: | 0.00055s | 49.31% | 31 | * | 2.0E-5s |
| Profile getArticleManufacturerUri: | 0.00037s | 33.13% | 6 | * | 6.0E-5s |
| Profile smarty_function_oxmultilang: | 0.0002s | 18.07% | 33 | * | 1.0E-5s |
| Profile _getLangTranslationArray: | 0.00017s | 15.36% | 49 | * | 0s |
| Profile _assignPriceInternal: | 0.00017s | 15.3% | 3 | * | 6.0E-5s |
| Profile executeMaintenanceTasks: | 0.00016s | 14.59% | 1 | * | 0.00016s |
| Profile fround: | 2.0E-5s | 1.9% | 22 | * | 0s |
| Profile articleAssignParentInternal: | 1.0E-5s | 0.92% | 8 | * | 0s |
| Profile oxviewconfig::getViewConfigParam: | 1.0E-5s | 0.77% | 25 | * | 0s |
| Profile _applyVAT: | 1.0E-5s | 0.62% | 4 | * | 0s |
| Profile isSearchEngine: | 1.0E-5s | 0.53% | 1 | * | 1.0E-5s |
| Profile oxviewconfig::setViewConfigParam: | 0s | 0.34% | 17 | * | 0s |

cl=oxwarticlebox(show/hide)
Memory usage: 3.502 MB (peak: 3.551 MB)
System memory usage: 2 MB (peak: 2 MB)
----------------------------------------------------------
System memory usage: 2 MB (peak: 2 MB)
Executed: 2024-05-10 20:32:38
Timestamp: 1715365958.3243
Execution time:0.0011----------------------------------------------------------
| Profile oxNew: | 0.01134s | 1036.43% | 143 | * | 8.0E-5s |
| Profile process: | 0.00636s | 581.59% | 7 | * | 0.00091s |
| Profile oxAutoload: | 0.00425s | 388.84% | 94 | * | 5.0E-5s |
| Profile loadinglists: | 0.00215s | 196.14% | 2 | * | 0.00107s |
| Profile buildTree: | 0.00185s | 169.01% | 1 | * | 0.00185s |
| Profile _getAmountPrice: | 0.00098s | 89.85% | 4 | * | 0.00025s |
| Profile articleAssign: | 0.00095s | 86.47% | 8 | * | 0.00012s |
| Profile getArticleMainUri: | 0.0009s | 82.63% | 3 | * | 0.0003s |
| Profile getCategory: | 0.00056s | 51.45% | 2 | * | 0.00028s |
| Profile seoencoder_loadFromCache: | 0.00055s | 50.69% | 33 | * | 2.0E-5s |
| Profile getArticleManufacturerUri: | 0.00037s | 33.8% | 6 | * | 6.0E-5s |
| Profile smarty_function_oxmultilang: | 0.0002s | 18.44% | 33 | * | 1.0E-5s |
| Profile _assignPriceInternal: | 0.00018s | 16.15% | 4 | * | 4.0E-5s |
| Profile _getLangTranslationArray: | 0.00017s | 15.93% | 50 | * | 0s |
| Profile executeMaintenanceTasks: | 0.00016s | 14.88% | 1 | * | 0.00016s |
| Profile fround: | 2.0E-5s | 2.11% | 25 | * | 0s |
| Profile articleAssignParentInternal: | 1.0E-5s | 0.94% | 8 | * | 0s |
| Profile _applyVAT: | 1.0E-5s | 0.81% | 5 | * | 0s |
| Profile oxviewconfig::getViewConfigParam: | 1.0E-5s | 0.78% | 26 | * | 0s |
| Profile isSearchEngine: | 1.0E-5s | 0.54% | 1 | * | 1.0E-5s |
| Profile oxviewconfig::setViewConfigParam: | 0s | 0.44% | 19 | * | 0s |
cl=oxwarticledetails(show/hide)
Memory usage: 3.568 MB (peak: 3.715 MB)
System memory usage: 4 MB (peak: 4 MB)
----------------------------------------------------------
System memory usage: 4 MB (peak: 4 MB)
Executed: 2024-05-10 20:32:38
Timestamp: 1715365958.3256
Execution time:0.0024----------------------------------------------------------
| Profile oxNew: | 0.01135s | 465.5% | 146 | * | 8.0E-5s |
| Profile process: | 0.00879s | 360.35% | 7 | * | 0.00126s |
| Profile oxAutoload: | 0.00425s | 174.43% | 94 | * | 5.0E-5s |
| Profile loadinglists: | 0.00287s | 117.83% | 3 | * | 0.00096s |
| Profile buildTree: | 0.00185s | 75.82% | 1 | * | 0.00185s |
| Profile _getAmountPrice: | 0.00098s | 40.3% | 4 | * | 0.00025s |
| Profile articleAssign: | 0.00095s | 38.79% | 8 | * | 0.00012s |
| Profile getArticleMainUri: | 0.0009s | 37.07% | 3 | * | 0.0003s |
| Profile getCategory: | 0.00056s | 23.08% | 2 | * | 0.00028s |
| Profile seoencoder_loadFromCache: | 0.00055s | 22.74% | 33 | * | 2.0E-5s |
| Profile getArticleManufacturerUri: | 0.00037s | 15.16% | 6 | * | 6.0E-5s |
| Profile smarty_function_oxmultilang: | 0.0002s | 8.27% | 33 | * | 1.0E-5s |
| Profile _getLangTranslationArray: | 0.00018s | 7.44% | 52 | * | 0s |
| Profile _assignPriceInternal: | 0.00018s | 7.24% | 4 | * | 4.0E-5s |
| Profile executeMaintenanceTasks: | 0.00016s | 6.68% | 1 | * | 0.00016s |
| Profile fround: | 2.0E-5s | 0.95% | 25 | * | 0s |
| Profile articleAssignParentInternal: | 1.0E-5s | 0.42% | 8 | * | 0s |
| Profile _applyVAT: | 1.0E-5s | 0.36% | 5 | * | 0s |
| Profile oxviewconfig::getViewConfigParam: | 1.0E-5s | 0.35% | 26 | * | 0s |
| Profile isSearchEngine: | 1.0E-5s | 0.24% | 1 | * | 1.0E-5s |
| Profile oxviewconfig::setViewConfigParam: | 0s | 0.2% | 19 | * | 0s |