 Sie haben Ihr Passwort vergessen?
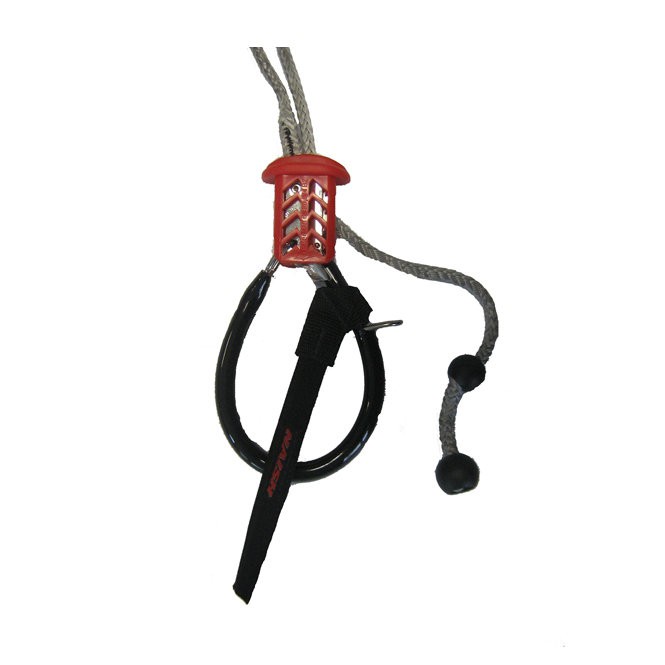
Smart Loop NAISH
Schon gesehen?
-

-
Trapez ION SOL KITE 2011
129,00 € * -
Trapez ION MADTRIXX
159,00 € * -
Kite Leinen VECTOR QUAD PRO
35,50 € *
cl=oxwarticlebox(show/hide)
Memory usage: 3.89 MB (peak: 3.938 MB)
System memory usage: 4 MB (peak: 4 MB)
----------------------------------------------------------
System memory usage: 4 MB (peak: 4 MB)
Executed: 2024-06-06 11:58:04
Timestamp: 1717667884.2623
Execution time:0.0013----------------------------------------------------------
| Profile oxNew: | 0.0126s | 1001.29% | 131 | * | 0.0001s |
| Profile oxAutoload: | 0.00434s | 344.88% | 94 | * | 5.0E-5s |
| Profile process: | 0.00376s | 298.6% | 5 | * | 0.00075s |
| Profile loadinglists: | 0.00195s | 155.27% | 2 | * | 0.00098s |
| Profile buildTree: | 0.00186s | 148.2% | 1 | * | 0.00186s |
| Profile articleAssign: | 0.00112s | 88.7% | 8 | * | 0.00014s |
| Profile seoencoder_loadFromCache: | 0.00083s | 65.73% | 29 | * | 3.0E-5s |
| Profile getCategory: | 0.00066s | 52.79% | 2 | * | 0.00033s |
| Profile _getAmountPrice: | 0.00056s | 44.84% | 2 | * | 0.00028s |
| Profile _getLangTranslationArray: | 0.00048s | 38.19% | 48 | * | 1.0E-5s |
| Profile getArticleManufacturerUri: | 0.00046s | 36.9% | 6 | * | 8.0E-5s |
| Profile getArticleMainUri: | 0.00031s | 24.39% | 1 | * | 0.00031s |
| Profile smarty_function_oxmultilang: | 0.00019s | 15.11% | 33 | * | 1.0E-5s |
| Profile executeMaintenanceTasks: | 0.00016s | 12.87% | 1 | * | 0.00016s |
| Profile _assignPriceInternal: | 0.00014s | 11.03% | 2 | * | 7.0E-5s |
| Profile fround: | 2.0E-5s | 1.74% | 19 | * | 0s |
| Profile articleAssignParentInternal: | 1.0E-5s | 0.8% | 8 | * | 0s |
| Profile isSearchEngine: | 1.0E-5s | 0.64% | 1 | * | 1.0E-5s |
| Profile oxviewconfig::getViewConfigParam: | 1.0E-5s | 0.45% | 24 | * | 0s |
| Profile _applyVAT: | 0s | 0.32% | 3 | * | 0s |
| Profile oxviewconfig::setViewConfigParam: | 0s | 0.32% | 15 | * | 0s |

cl=oxwarticlebox(show/hide)
Memory usage: 3.905 MB (peak: 3.953 MB)
System memory usage: 4 MB (peak: 4 MB)
----------------------------------------------------------
System memory usage: 4 MB (peak: 4 MB)
Executed: 2024-06-06 11:58:04
Timestamp: 1717667884.2637
Execution time:0.0012----------------------------------------------------------
| Profile oxNew: | 0.01262s | 1023.45% | 137 | * | 9.0E-5s |
| Profile process: | 0.00498s | 403.94% | 6 | * | 0.00083s |
| Profile oxAutoload: | 0.00434s | 351.82% | 94 | * | 5.0E-5s |
| Profile loadinglists: | 0.00195s | 158.39% | 2 | * | 0.00098s |
| Profile buildTree: | 0.00186s | 151.18% | 1 | * | 0.00186s |
| Profile articleAssign: | 0.00112s | 90.49% | 8 | * | 0.00014s |
| Profile seoencoder_loadFromCache: | 0.00083s | 67.21% | 31 | * | 3.0E-5s |
| Profile _getAmountPrice: | 0.00071s | 57.42% | 3 | * | 0.00024s |
| Profile getCategory: | 0.00066s | 53.85% | 2 | * | 0.00033s |
| Profile getArticleMainUri: | 0.00057s | 46.11% | 2 | * | 0.00028s |
| Profile _getLangTranslationArray: | 0.00048s | 39.21% | 49 | * | 1.0E-5s |
| Profile getArticleManufacturerUri: | 0.00046s | 37.65% | 6 | * | 8.0E-5s |
| Profile smarty_function_oxmultilang: | 0.00019s | 15.41% | 33 | * | 1.0E-5s |
| Profile executeMaintenanceTasks: | 0.00016s | 13.13% | 1 | * | 0.00016s |
| Profile _assignPriceInternal: | 0.00014s | 11.74% | 3 | * | 5.0E-5s |
| Profile fround: | 2.0E-5s | 1.88% | 22 | * | 0s |
| Profile articleAssignParentInternal: | 1.0E-5s | 0.81% | 8 | * | 0s |
| Profile isSearchEngine: | 1.0E-5s | 0.66% | 1 | * | 1.0E-5s |
| Profile _applyVAT: | 1.0E-5s | 0.48% | 4 | * | 0s |
| Profile oxviewconfig::getViewConfigParam: | 1.0E-5s | 0.46% | 25 | * | 0s |
| Profile oxviewconfig::setViewConfigParam: | 1.0E-5s | 0.43% | 17 | * | 0s |

cl=oxwarticlebox(show/hide)
Memory usage: 3.937 MB (peak: 3.984 MB)
System memory usage: 4 MB (peak: 4 MB)
----------------------------------------------------------
System memory usage: 4 MB (peak: 4 MB)
Executed: 2024-06-06 11:58:04
Timestamp: 1717667884.2649
Execution time:0.0012----------------------------------------------------------
| Profile oxNew: | 0.01264s | 1063.1% | 143 | * | 9.0E-5s |
| Profile process: | 0.00616s | 518.35% | 7 | * | 0.00088s |
| Profile oxAutoload: | 0.00434s | 364.87% | 94 | * | 5.0E-5s |
| Profile loadinglists: | 0.00195s | 164.27% | 2 | * | 0.00098s |
| Profile buildTree: | 0.00186s | 156.79% | 1 | * | 0.00186s |
| Profile articleAssign: | 0.00112s | 93.84% | 8 | * | 0.00014s |
| Profile _getAmountPrice: | 0.00084s | 70.72% | 4 | * | 0.00021s |
| Profile getArticleMainUri: | 0.00084s | 70.46% | 3 | * | 0.00028s |
| Profile seoencoder_loadFromCache: | 0.00083s | 69.86% | 33 | * | 3.0E-5s |
| Profile getCategory: | 0.00066s | 55.85% | 2 | * | 0.00033s |
| Profile _getLangTranslationArray: | 0.00049s | 40.93% | 50 | * | 1.0E-5s |
| Profile getArticleManufacturerUri: | 0.00046s | 39.04% | 6 | * | 8.0E-5s |
| Profile smarty_function_oxmultilang: | 0.00019s | 15.98% | 33 | * | 1.0E-5s |
| Profile executeMaintenanceTasks: | 0.00016s | 13.62% | 1 | * | 0.00016s |
| Profile _assignPriceInternal: | 0.00015s | 12.75% | 4 | * | 4.0E-5s |
| Profile fround: | 2.0E-5s | 1.95% | 25 | * | 0s |
| Profile articleAssignParentInternal: | 1.0E-5s | 0.84% | 8 | * | 0s |
| Profile isSearchEngine: | 1.0E-5s | 0.68% | 1 | * | 1.0E-5s |
| Profile _applyVAT: | 1.0E-5s | 0.58% | 5 | * | 0s |
| Profile oxviewconfig::getViewConfigParam: | 1.0E-5s | 0.48% | 26 | * | 0s |
| Profile oxviewconfig::setViewConfigParam: | 1.0E-5s | 0.44% | 19 | * | 0s |
cl=oxwarticledetails(show/hide)
Memory usage: 3.937 MB (peak: 4.095 MB)
System memory usage: 4 MB (peak: 4 MB)
----------------------------------------------------------
System memory usage: 4 MB (peak: 4 MB)
Executed: 2024-06-06 11:58:04
Timestamp: 1717667884.2662
Execution time:0.0025----------------------------------------------------------
| Profile oxNew: | 0.01265s | 508.38% | 146 | * | 9.0E-5s |
| Profile process: | 0.00864s | 347.27% | 7 | * | 0.00123s |
| Profile oxAutoload: | 0.00434s | 174.31% | 94 | * | 5.0E-5s |
| Profile loadinglists: | 0.00263s | 105.76% | 3 | * | 0.00088s |
| Profile buildTree: | 0.00186s | 74.9% | 1 | * | 0.00186s |
| Profile articleAssign: | 0.00112s | 44.83% | 8 | * | 0.00014s |
| Profile _getAmountPrice: | 0.00084s | 33.79% | 4 | * | 0.00021s |
| Profile getArticleMainUri: | 0.00084s | 33.66% | 3 | * | 0.00028s |
| Profile seoencoder_loadFromCache: | 0.00083s | 33.37% | 33 | * | 3.0E-5s |
| Profile getCategory: | 0.00066s | 26.68% | 2 | * | 0.00033s |
| Profile _getLangTranslationArray: | 0.00049s | 19.74% | 52 | * | 1.0E-5s |
| Profile getArticleManufacturerUri: | 0.00046s | 18.65% | 6 | * | 8.0E-5s |
| Profile smarty_function_oxmultilang: | 0.00019s | 7.63% | 33 | * | 1.0E-5s |
| Profile executeMaintenanceTasks: | 0.00016s | 6.5% | 1 | * | 0.00016s |
| Profile _assignPriceInternal: | 0.00015s | 6.09% | 4 | * | 4.0E-5s |
| Profile fround: | 2.0E-5s | 0.93% | 25 | * | 0s |
| Profile articleAssignParentInternal: | 1.0E-5s | 0.4% | 8 | * | 0s |
| Profile isSearchEngine: | 1.0E-5s | 0.33% | 1 | * | 1.0E-5s |
| Profile _applyVAT: | 1.0E-5s | 0.28% | 5 | * | 0s |
| Profile oxviewconfig::getViewConfigParam: | 1.0E-5s | 0.23% | 26 | * | 0s |
| Profile oxviewconfig::setViewConfigParam: | 1.0E-5s | 0.21% | 19 | * | 0s |