 Sie haben Ihr Passwort vergessen?
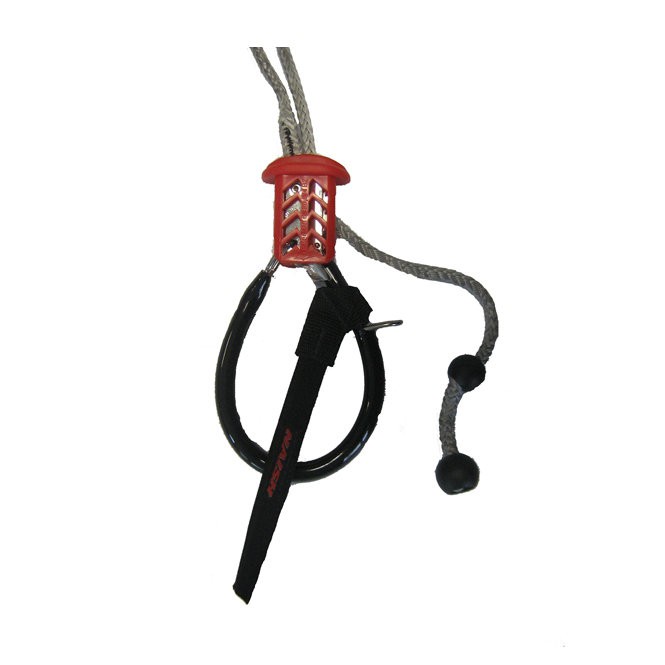
Smart Loop NAISH
Schon gesehen?
-

-
Trapez ION SOL KITE 2011
129,00 € * -
Trapez ION MADTRIXX
159,00 € * -
Kite Leinen VECTOR QUAD PRO
35,50 € *
cl=oxwarticlebox(show/hide)
Memory usage: 3.458 MB (peak: 3.506 MB)
System memory usage: 2 MB (peak: 2 MB)
----------------------------------------------------------
System memory usage: 2 MB (peak: 2 MB)
Executed: 2024-05-29 12:14:49
Timestamp: 1716977689.5751
Execution time:0.0014----------------------------------------------------------
| Profile oxNew: | 0.01293s | 945.8% | 131 | * | 0.0001s |
| Profile oxAutoload: | 0.00475s | 347.24% | 94 | * | 5.0E-5s |
| Profile process: | 0.00428s | 313.38% | 5 | * | 0.00086s |
| Profile loadinglists: | 0.00254s | 185.94% | 2 | * | 0.00127s |
| Profile buildTree: | 0.0021s | 153.4% | 1 | * | 0.0021s |
| Profile articleAssign: | 0.00115s | 83.87% | 8 | * | 0.00014s |
| Profile seoencoder_loadFromCache: | 0.0008s | 58.69% | 29 | * | 3.0E-5s |
| Profile getCategory: | 0.00077s | 56.38% | 2 | * | 0.00039s |
| Profile _getAmountPrice: | 0.00067s | 48.71% | 2 | * | 0.00033s |
| Profile getArticleManufacturerUri: | 0.00047s | 34.09% | 6 | * | 8.0E-5s |
| Profile getArticleMainUri: | 0.0003s | 21.66% | 1 | * | 0.0003s |
| Profile smarty_function_oxmultilang: | 0.00022s | 16.18% | 33 | * | 1.0E-5s |
| Profile _getLangTranslationArray: | 0.0002s | 14.42% | 48 | * | 0s |
| Profile executeMaintenanceTasks: | 0.00019s | 13.83% | 1 | * | 0.00019s |
| Profile _assignPriceInternal: | 0.00015s | 11.2% | 2 | * | 8.0E-5s |
| Profile fround: | 2.0E-5s | 1.81% | 19 | * | 0s |
| Profile oxviewconfig::getViewConfigParam: | 1.0E-5s | 0.87% | 24 | * | 0s |
| Profile isSearchEngine: | 1.0E-5s | 0.73% | 1 | * | 1.0E-5s |
| Profile articleAssignParentInternal: | 1.0E-5s | 0.72% | 8 | * | 0s |
| Profile oxviewconfig::setViewConfigParam: | 1.0E-5s | 0.37% | 15 | * | 0s |
| Profile _applyVAT: | 0s | 0.31% | 3 | * | 0s |

cl=oxwarticlebox(show/hide)
Memory usage: 3.473 MB (peak: 3.521 MB)
System memory usage: 2 MB (peak: 2 MB)
----------------------------------------------------------
System memory usage: 2 MB (peak: 2 MB)
Executed: 2024-05-29 12:14:49
Timestamp: 1716977689.5762
Execution time:0.0011----------------------------------------------------------
| Profile oxNew: | 0.01295s | 1161.87% | 137 | * | 9.0E-5s |
| Profile process: | 0.00539s | 483.58% | 6 | * | 0.0009s |
| Profile oxAutoload: | 0.00475s | 425.81% | 94 | * | 5.0E-5s |
| Profile loadinglists: | 0.00254s | 228.02% | 2 | * | 0.00127s |
| Profile buildTree: | 0.0021s | 188.11% | 1 | * | 0.0021s |
| Profile articleAssign: | 0.00115s | 102.84% | 8 | * | 0.00014s |
| Profile seoencoder_loadFromCache: | 0.00081s | 72.33% | 31 | * | 3.0E-5s |
| Profile _getAmountPrice: | 0.00079s | 70.68% | 3 | * | 0.00026s |
| Profile getCategory: | 0.00077s | 69.14% | 2 | * | 0.00039s |
| Profile getArticleMainUri: | 0.00059s | 52.59% | 2 | * | 0.00029s |
| Profile getArticleManufacturerUri: | 0.00047s | 41.81% | 6 | * | 8.0E-5s |
| Profile smarty_function_oxmultilang: | 0.00022s | 19.85% | 33 | * | 1.0E-5s |
| Profile _getLangTranslationArray: | 0.0002s | 17.96% | 49 | * | 0s |
| Profile executeMaintenanceTasks: | 0.00019s | 16.96% | 1 | * | 0.00019s |
| Profile _assignPriceInternal: | 0.00016s | 14.35% | 3 | * | 5.0E-5s |
| Profile fround: | 3.0E-5s | 2.31% | 22 | * | 0s |
| Profile oxviewconfig::getViewConfigParam: | 1.0E-5s | 1.15% | 25 | * | 0s |
| Profile isSearchEngine: | 1.0E-5s | 0.9% | 1 | * | 1.0E-5s |
| Profile articleAssignParentInternal: | 1.0E-5s | 0.88% | 8 | * | 0s |
| Profile oxviewconfig::setViewConfigParam: | 1.0E-5s | 0.53% | 17 | * | 0s |
| Profile _applyVAT: | 1.0E-5s | 0.47% | 4 | * | 0s |

cl=oxwarticlebox(show/hide)
Memory usage: 3.505 MB (peak: 3.553 MB)
System memory usage: 2 MB (peak: 2 MB)
----------------------------------------------------------
System memory usage: 2 MB (peak: 2 MB)
Executed: 2024-05-29 12:14:49
Timestamp: 1716977689.5775
Execution time:0.0012----------------------------------------------------------
| Profile oxNew: | 0.01297s | 1112.59% | 143 | * | 9.0E-5s |
| Profile process: | 0.00655s | 561.73% | 7 | * | 0.00094s |
| Profile oxAutoload: | 0.00475s | 407.09% | 94 | * | 5.0E-5s |
| Profile loadinglists: | 0.00254s | 217.99% | 2 | * | 0.00127s |
| Profile buildTree: | 0.0021s | 179.84% | 1 | * | 0.0021s |
| Profile articleAssign: | 0.00115s | 98.32% | 8 | * | 0.00014s |
| Profile _getAmountPrice: | 0.0009s | 77.43% | 4 | * | 0.00023s |
| Profile getArticleMainUri: | 0.00084s | 72.05% | 3 | * | 0.00028s |
| Profile seoencoder_loadFromCache: | 0.00081s | 69.47% | 33 | * | 2.0E-5s |
| Profile getCategory: | 0.00077s | 66.1% | 2 | * | 0.00039s |
| Profile getArticleManufacturerUri: | 0.00047s | 39.97% | 6 | * | 8.0E-5s |
| Profile smarty_function_oxmultilang: | 0.00022s | 18.97% | 33 | * | 1.0E-5s |
| Profile _getLangTranslationArray: | 0.0002s | 17.34% | 50 | * | 0s |
| Profile executeMaintenanceTasks: | 0.00019s | 16.21% | 1 | * | 0.00019s |
| Profile _assignPriceInternal: | 0.00017s | 14.33% | 4 | * | 4.0E-5s |
| Profile fround: | 3.0E-5s | 2.39% | 25 | * | 0s |
| Profile oxviewconfig::getViewConfigParam: | 1.0E-5s | 1.1% | 26 | * | 0s |
| Profile isSearchEngine: | 1.0E-5s | 0.86% | 1 | * | 1.0E-5s |
| Profile articleAssignParentInternal: | 1.0E-5s | 0.84% | 8 | * | 0s |
| Profile _applyVAT: | 1.0E-5s | 0.63% | 5 | * | 0s |
| Profile oxviewconfig::setViewConfigParam: | 1.0E-5s | 0.61% | 19 | * | 0s |
cl=oxwarticledetails(show/hide)
Memory usage: 3.57 MB (peak: 3.718 MB)
System memory usage: 4 MB (peak: 4 MB)
----------------------------------------------------------
System memory usage: 4 MB (peak: 4 MB)
Executed: 2024-05-29 12:14:49
Timestamp: 1716977689.5791
Execution time:0.0028----------------------------------------------------------
| Profile oxNew: | 0.01299s | 467.23% | 146 | * | 9.0E-5s |
| Profile process: | 0.00932s | 335.2% | 7 | * | 0.00133s |
| Profile oxAutoload: | 0.00475s | 170.76% | 94 | * | 5.0E-5s |
| Profile loadinglists: | 0.00341s | 122.63% | 3 | * | 0.00114s |
| Profile buildTree: | 0.0021s | 75.44% | 1 | * | 0.0021s |
| Profile articleAssign: | 0.00115s | 41.24% | 8 | * | 0.00014s |
| Profile _getAmountPrice: | 0.0009s | 32.48% | 4 | * | 0.00023s |
| Profile getArticleMainUri: | 0.00084s | 30.22% | 3 | * | 0.00028s |
| Profile seoencoder_loadFromCache: | 0.00081s | 29.14% | 33 | * | 2.0E-5s |
| Profile getCategory: | 0.00077s | 27.73% | 2 | * | 0.00039s |
| Profile getArticleManufacturerUri: | 0.00047s | 16.77% | 6 | * | 8.0E-5s |
| Profile smarty_function_oxmultilang: | 0.00022s | 7.96% | 33 | * | 1.0E-5s |
| Profile _getLangTranslationArray: | 0.00021s | 7.56% | 52 | * | 0s |
| Profile executeMaintenanceTasks: | 0.00019s | 6.8% | 1 | * | 0.00019s |
| Profile _assignPriceInternal: | 0.00017s | 6.01% | 4 | * | 4.0E-5s |
| Profile fround: | 3.0E-5s | 1% | 25 | * | 0s |
| Profile oxviewconfig::getViewConfigParam: | 1.0E-5s | 0.46% | 26 | * | 0s |
| Profile isSearchEngine: | 1.0E-5s | 0.36% | 1 | * | 1.0E-5s |
| Profile articleAssignParentInternal: | 1.0E-5s | 0.35% | 8 | * | 0s |
| Profile _applyVAT: | 1.0E-5s | 0.27% | 5 | * | 0s |
| Profile oxviewconfig::setViewConfigParam: | 1.0E-5s | 0.26% | 19 | * | 0s |