 Sie haben Ihr Passwort vergessen?
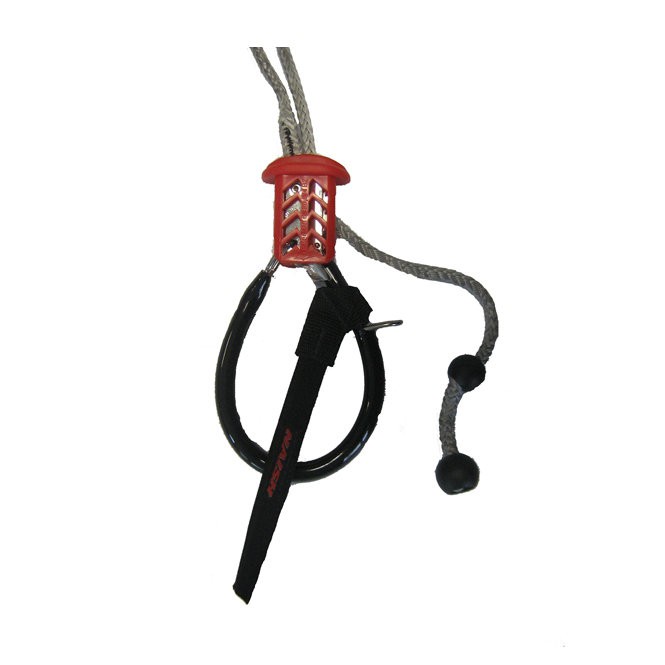
Smart Loop NAISH
Schon gesehen?
-

-
Trapez ION SOL KITE 2011
129,00 € * -
Trapez ION MADTRIXX
159,00 € * -
Kite Leinen VECTOR QUAD PRO
35,50 € *
cl=oxwarticlebox(show/hide)
Memory usage: 3.711 MB (peak: 3.81 MB)
System memory usage: 4 MB (peak: 4 MB)
----------------------------------------------------------
System memory usage: 4 MB (peak: 4 MB)
Executed: 2024-05-13 07:22:17
Timestamp: 1715577737.735
Execution time:0.0011----------------------------------------------------------
| Profile oxNew: | 0.01079s | 944.8% | 131 | * | 8.0E-5s |
| Profile process: | 0.00422s | 369.6% | 5 | * | 0.00084s |
| Profile oxAutoload: | 0.0038s | 332.65% | 94 | * | 4.0E-5s |
| Profile loadinglists: | 0.0021s | 183.7% | 2 | * | 0.00105s |
| Profile buildTree: | 0.00195s | 170.56% | 1 | * | 0.00195s |
| Profile articleAssign: | 0.00116s | 101.15% | 8 | * | 0.00014s |
| Profile getCategory: | 0.00069s | 60.69% | 2 | * | 0.00035s |
| Profile seoencoder_loadFromCache: | 0.00055s | 48.31% | 29 | * | 2.0E-5s |
| Profile _getAmountPrice: | 0.00051s | 44.49% | 2 | * | 0.00025s |
| Profile _getLangTranslationArray: | 0.00049s | 42.61% | 48 | * | 1.0E-5s |
| Profile getArticleManufacturerUri: | 0.00034s | 29.6% | 6 | * | 6.0E-5s |
| Profile getArticleMainUri: | 0.00032s | 27.85% | 1 | * | 0.00032s |
| Profile smarty_function_oxmultilang: | 0.00019s | 16.78% | 33 | * | 1.0E-5s |
| Profile _assignPriceInternal: | 0.00015s | 13.22% | 2 | * | 8.0E-5s |
| Profile executeMaintenanceTasks: | 0.00015s | 13.05% | 1 | * | 0.00015s |
| Profile fround: | 2.0E-5s | 1.52% | 19 | * | 0s |
| Profile articleAssignParentInternal: | 1.0E-5s | 1.06% | 8 | * | 0s |
| Profile oxviewconfig::getViewConfigParam: | 1.0E-5s | 0.98% | 24 | * | 0s |
| Profile isSearchEngine: | 1.0E-5s | 0.71% | 1 | * | 1.0E-5s |
| Profile oxviewconfig::setViewConfigParam: | 1.0E-5s | 0.46% | 15 | * | 0s |
| Profile _applyVAT: | 1.0E-5s | 0.46% | 3 | * | 0s |

cl=oxwarticlebox(show/hide)
Memory usage: 3.726 MB (peak: 3.824 MB)
System memory usage: 4 MB (peak: 4 MB)
----------------------------------------------------------
System memory usage: 4 MB (peak: 4 MB)
Executed: 2024-05-13 07:22:17
Timestamp: 1715577737.7358
Execution time:0.0008----------------------------------------------------------
| Profile oxNew: | 0.0108s | 1350.33% | 137 | * | 8.0E-5s |
| Profile process: | 0.00502s | 626.91% | 6 | * | 0.00084s |
| Profile oxAutoload: | 0.0038s | 474.79% | 94 | * | 4.0E-5s |
| Profile loadinglists: | 0.0021s | 262.19% | 2 | * | 0.00105s |
| Profile buildTree: | 0.00195s | 243.44% | 1 | * | 0.00195s |
| Profile articleAssign: | 0.00116s | 144.37% | 8 | * | 0.00014s |
| Profile getCategory: | 0.00069s | 86.62% | 2 | * | 0.00035s |
| Profile _getAmountPrice: | 0.00059s | 73.63% | 3 | * | 0.0002s |
| Profile seoencoder_loadFromCache: | 0.00055s | 69.19% | 31 | * | 2.0E-5s |
| Profile getArticleMainUri: | 0.00051s | 64.36% | 2 | * | 0.00026s |
| Profile _getLangTranslationArray: | 0.00049s | 60.94% | 49 | * | 1.0E-5s |
| Profile getArticleManufacturerUri: | 0.00034s | 42.25% | 6 | * | 6.0E-5s |
| Profile smarty_function_oxmultilang: | 0.00019s | 23.96% | 33 | * | 1.0E-5s |
| Profile _assignPriceInternal: | 0.00015s | 19.37% | 3 | * | 5.0E-5s |
| Profile executeMaintenanceTasks: | 0.00015s | 18.62% | 1 | * | 0.00015s |
| Profile fround: | 2.0E-5s | 2.29% | 22 | * | 0s |
| Profile articleAssignParentInternal: | 1.0E-5s | 1.52% | 8 | * | 0s |
| Profile oxviewconfig::getViewConfigParam: | 1.0E-5s | 1.52% | 25 | * | 0s |
| Profile isSearchEngine: | 1.0E-5s | 1.01% | 1 | * | 1.0E-5s |
| Profile oxviewconfig::setViewConfigParam: | 1.0E-5s | 0.8% | 17 | * | 0s |
| Profile _applyVAT: | 1.0E-5s | 0.77% | 4 | * | 0s |

cl=oxwarticlebox(show/hide)
Memory usage: 3.758 MB (peak: 3.855 MB)
System memory usage: 4 MB (peak: 4 MB)
----------------------------------------------------------
System memory usage: 4 MB (peak: 4 MB)
Executed: 2024-05-13 07:22:17
Timestamp: 1715577737.7367
Execution time:0.0008----------------------------------------------------------
| Profile oxNew: | 0.01081s | 1301.23% | 143 | * | 8.0E-5s |
| Profile process: | 0.00584s | 703.04% | 7 | * | 0.00083s |
| Profile oxAutoload: | 0.0038s | 457.09% | 94 | * | 4.0E-5s |
| Profile loadinglists: | 0.0021s | 252.41% | 2 | * | 0.00105s |
| Profile buildTree: | 0.00195s | 234.37% | 1 | * | 0.00195s |
| Profile articleAssign: | 0.00116s | 138.98% | 8 | * | 0.00014s |
| Profile _getAmountPrice: | 0.00072s | 86.55% | 4 | * | 0.00018s |
| Profile getArticleMainUri: | 0.00071s | 85.43% | 3 | * | 0.00024s |
| Profile getCategory: | 0.00069s | 83.39% | 2 | * | 0.00035s |
| Profile seoencoder_loadFromCache: | 0.00056s | 66.84% | 33 | * | 2.0E-5s |
| Profile _getLangTranslationArray: | 0.00049s | 58.89% | 50 | * | 1.0E-5s |
| Profile getArticleManufacturerUri: | 0.00034s | 40.68% | 6 | * | 6.0E-5s |
| Profile smarty_function_oxmultilang: | 0.00019s | 23.06% | 33 | * | 1.0E-5s |
| Profile _assignPriceInternal: | 0.00016s | 19.13% | 4 | * | 4.0E-5s |
| Profile executeMaintenanceTasks: | 0.00015s | 17.93% | 1 | * | 0.00015s |
| Profile fround: | 2.0E-5s | 2.21% | 25 | * | 0s |
| Profile articleAssignParentInternal: | 1.0E-5s | 1.46% | 8 | * | 0s |
| Profile oxviewconfig::getViewConfigParam: | 1.0E-5s | 1.46% | 26 | * | 0s |
| Profile oxviewconfig::setViewConfigParam: | 1.0E-5s | 1% | 19 | * | 0s |
| Profile isSearchEngine: | 1.0E-5s | 0.98% | 1 | * | 1.0E-5s |
| Profile _applyVAT: | 1.0E-5s | 0.89% | 5 | * | 0s |
cl=oxwarticledetails(show/hide)
Memory usage: 3.742 MB (peak: 3.9 MB)
System memory usage: 4 MB (peak: 4 MB)
----------------------------------------------------------
System memory usage: 4 MB (peak: 4 MB)
Executed: 2024-05-13 07:22:17
Timestamp: 1715577737.7379
Execution time:0.002----------------------------------------------------------
| Profile oxNew: | 0.01082s | 542.8% | 146 | * | 7.0E-5s |
| Profile process: | 0.00783s | 392.41% | 7 | * | 0.00112s |
| Profile oxAutoload: | 0.0038s | 190.51% | 94 | * | 4.0E-5s |
| Profile loadinglists: | 0.00261s | 130.77% | 3 | * | 0.00087s |
| Profile buildTree: | 0.00195s | 97.68% | 1 | * | 0.00195s |
| Profile articleAssign: | 0.00116s | 57.93% | 8 | * | 0.00014s |
| Profile _getAmountPrice: | 0.00072s | 36.07% | 4 | * | 0.00018s |
| Profile getArticleMainUri: | 0.00071s | 35.6% | 3 | * | 0.00024s |
| Profile getCategory: | 0.00069s | 34.76% | 2 | * | 0.00035s |
| Profile seoencoder_loadFromCache: | 0.00056s | 27.86% | 33 | * | 2.0E-5s |
| Profile _getLangTranslationArray: | 0.0005s | 24.89% | 52 | * | 1.0E-5s |
| Profile getArticleManufacturerUri: | 0.00034s | 16.95% | 6 | * | 6.0E-5s |
| Profile smarty_function_oxmultilang: | 0.00019s | 9.61% | 33 | * | 1.0E-5s |
| Profile _assignPriceInternal: | 0.00016s | 7.97% | 4 | * | 4.0E-5s |
| Profile executeMaintenanceTasks: | 0.00015s | 7.47% | 1 | * | 0.00015s |
| Profile fround: | 2.0E-5s | 0.92% | 25 | * | 0s |
| Profile articleAssignParentInternal: | 1.0E-5s | 0.61% | 8 | * | 0s |
| Profile oxviewconfig::getViewConfigParam: | 1.0E-5s | 0.61% | 26 | * | 0s |
| Profile oxviewconfig::setViewConfigParam: | 1.0E-5s | 0.42% | 19 | * | 0s |
| Profile isSearchEngine: | 1.0E-5s | 0.41% | 1 | * | 1.0E-5s |
| Profile _applyVAT: | 1.0E-5s | 0.37% | 5 | * | 0s |