ärmellos
träger
shirt
pima
lässig
longsleeve
locker
liquid force
langarm
kuyichi
kurz
kiteboarding
kiteboard
kite
jeans
gerade
dunkel
board
anna
2010
Mehr...
cl=oxwcookienote(show/hide)
Memory usage: 3.159 MB (peak: 3.194 MB)
System memory usage: 2 MB (peak: 2 MB)
Execution time:0.0008
----------------------------------------------------------
System memory usage: 2 MB (peak: 2 MB)
Execution time:0.0008
----------------------------------------------------------
| Profile process: | 0.0069s | 855.46% | 9 | * | 0.00077s |
| Profile oxNew: | 0.00684s | 848.36% | 124 | * | 6.0E-5s |
| Profile oxAutoload: | 0.00286s | 354.51% | 79 | * | 4.0E-5s |
| Profile getArticleManufacturerUri: | 0.00126s | 155.69% | 7 | * | 0.00018s |
| Profile buildTree: | 0.00116s | 143.3% | 1 | * | 0.00116s |
| Profile loadinglists: | 0.0009s | 111.03% | 1 | * | 0.0009s |
| Profile _getAmountPrice: | 0.00087s | 108.07% | 7 | * | 0.00012s |
| Profile articleAssign: | 0.0003s | 37.47% | 7 | * | 4.0E-5s |
| Profile executeMaintenanceTasks: | 0.00029s | 36.35% | 1 | * | 0.00029s |
| Profile seoencoder_loadFromCache: | 0.00021s | 25.67% | 21 | * | 1.0E-5s |
| Profile _assignPriceInternal: | 0.00013s | 16.36% | 7 | * | 2.0E-5s |
| Profile _getLangTranslationArray: | 9.0E-5s | 11.48% | 34 | * | 0s |
| Profile smarty_function_oxmultilang: | 8.0E-5s | 9.41% | 23 | * | 0s |
| Profile fround: | 2.0E-5s | 1.98% | 53 | * | 0s |
| Profile _applyVAT: | 1.0E-5s | 1.36% | 14 | * | 0s |
| Profile isSearchEngine: | 1.0E-5s | 1.01% | 1 | * | 1.0E-5s |
| Profile generatePageNavigation: | 1.0E-5s | 0.98% | 2 | * | 0s |
| Profile articleAssignParentInternal: | 0s | 0.35% | 7 | * | 0s |
| Profile oxviewconfig::setViewConfigParam: | 0s | 0.35% | 16 | * | 0s |
| Profile oxviewconfig::getViewConfigParam: | 0s | 0.24% | 11 | * | 0s |
cl=oxwlanguagelist(show/hide)
Memory usage: 3.197 MB (peak: 3.244 MB)
System memory usage: 2 MB (peak: 2 MB)
----------------------------------------------------------
System memory usage: 2 MB (peak: 2 MB)
Executed: 2024-06-11 03:44:56
Timestamp: 1718070296.751
Execution time:0.0011----------------------------------------------------------
| Profile process: | 0.00799s | 726.2% | 10 | * | 0.0008s |
| Profile oxNew: | 0.00701s | 636.89% | 127 | * | 6.0E-5s |
| Profile oxAutoload: | 0.0029s | 263.68% | 80 | * | 4.0E-5s |
| Profile getArticleManufacturerUri: | 0.00126s | 114.09% | 7 | * | 0.00018s |
| Profile buildTree: | 0.00116s | 105.01% | 1 | * | 0.00116s |
| Profile loadinglists: | 0.0009s | 81.36% | 1 | * | 0.0009s |
| Profile _getAmountPrice: | 0.00087s | 79.19% | 7 | * | 0.00012s |
| Profile articleAssign: | 0.0003s | 27.46% | 7 | * | 4.0E-5s |
| Profile executeMaintenanceTasks: | 0.00029s | 26.64% | 1 | * | 0.00029s |
| Profile seoencoder_loadFromCache: | 0.00021s | 18.81% | 21 | * | 1.0E-5s |
| Profile _assignPriceInternal: | 0.00013s | 11.99% | 7 | * | 2.0E-5s |
| Profile _getLangTranslationArray: | 0.0001s | 8.67% | 35 | * | 0s |
| Profile smarty_function_oxmultilang: | 8.0E-5s | 6.89% | 23 | * | 0s |
| Profile fround: | 2.0E-5s | 1.45% | 53 | * | 0s |
| Profile _applyVAT: | 1.0E-5s | 1% | 14 | * | 0s |
| Profile isSearchEngine: | 1.0E-5s | 0.74% | 1 | * | 1.0E-5s |
| Profile generatePageNavigation: | 1.0E-5s | 0.72% | 2 | * | 0s |
| Profile articleAssignParentInternal: | 0s | 0.26% | 7 | * | 0s |
| Profile oxviewconfig::setViewConfigParam: | 0s | 0.26% | 19 | * | 0s |
| Profile oxviewconfig::getViewConfigParam: | 0s | 0.17% | 13 | * | 0s |
cl=oxwcurrencylist(show/hide)
Memory usage: 3.248 MB (peak: 3.295 MB)
System memory usage: 2 MB (peak: 2 MB)
----------------------------------------------------------
System memory usage: 2 MB (peak: 2 MB)
Executed: 2024-06-11 03:44:56
Timestamp: 1718070296.7518
Execution time:0.0007----------------------------------------------------------
| Profile process: | 0.00866s | 1280.71% | 11 | * | 0.00079s |
| Profile oxNew: | 0.00714s | 1056.56% | 130 | * | 5.0E-5s |
| Profile oxAutoload: | 0.00293s | 433.85% | 81 | * | 4.0E-5s |
| Profile getArticleManufacturerUri: | 0.00126s | 185.61% | 7 | * | 0.00018s |
| Profile buildTree: | 0.00116s | 170.84% | 1 | * | 0.00116s |
| Profile loadinglists: | 0.0009s | 132.37% | 1 | * | 0.0009s |
| Profile _getAmountPrice: | 0.00087s | 128.84% | 7 | * | 0.00012s |
| Profile articleAssign: | 0.0003s | 44.68% | 7 | * | 4.0E-5s |
| Profile executeMaintenanceTasks: | 0.00029s | 43.34% | 1 | * | 0.00029s |
| Profile seoencoder_loadFromCache: | 0.00021s | 30.61% | 21 | * | 1.0E-5s |
| Profile _assignPriceInternal: | 0.00013s | 19.5% | 7 | * | 2.0E-5s |
| Profile _getLangTranslationArray: | 0.0001s | 14.39% | 36 | * | 0s |
| Profile smarty_function_oxmultilang: | 8.0E-5s | 11.21% | 23 | * | 0s |
| Profile fround: | 2.0E-5s | 2.36% | 53 | * | 0s |
| Profile _applyVAT: | 1.0E-5s | 1.62% | 14 | * | 0s |
| Profile isSearchEngine: | 1.0E-5s | 1.2% | 1 | * | 1.0E-5s |
| Profile generatePageNavigation: | 1.0E-5s | 1.16% | 2 | * | 0s |
| Profile oxviewconfig::setViewConfigParam: | 0s | 0.56% | 21 | * | 0s |
| Profile oxviewconfig::getViewConfigParam: | 0s | 0.46% | 14 | * | 0s |
| Profile articleAssignParentInternal: | 0s | 0.42% | 7 | * | 0s |
-
Anmelden
 Sie haben Ihr Passwort vergessen?
Kein Problem! Hier können Sie ein neues Passwort einrichten.
Sie erhalten eine E-Mail mit einem Link, um ein neues Passwort zu vergeben.
Sollten Sie innerhalb der nächsten Minuten KEINE E-Mail mit Ihren Zugangsdaten erhalten, so überprüfen Sie bitte: Haben Sie sich in unserem Shop bereits registriert? Wenn nicht, so tun Sie dies bitte einmalig im Rahmen des Bestellprozesses. Sie können dann selbst ein Passwort festlegen. Sobald Sie registriert sind, können Sie sich in Zukunft mit Ihrer E-Mail-Adresse und Ihrem Passwort einloggen.- Wenn Sie sich sicher sind, dass Sie sich in unserem Shop bereits registriert haben, dann überprüfen Sie bitte, ob Sie sich bei der Eingabe Ihrer E-Mail-Adresse evtl. vertippt haben.
Sollten Sie trotz korrekter E-Mail-Adresse und bereits bestehender Registrierung weiterhin Probleme mit dem Login haben und auch keine "Passwort vergessen"-E-Mail erhalten, so wenden Sie sich bitte per E-Mail an:
- Registrieren
cl=oxwservicemenu(show/hide)
Memory usage: 3.438 MB (peak: 3.602 MB)
System memory usage: 2 MB (peak: 2 MB)
Execution time:0.0035
----------------------------------------------------------
System memory usage: 2 MB (peak: 2 MB)
Execution time:0.0035
----------------------------------------------------------
| Profile process: | 0.01217s | 345.94% | 12 | * | 0.00101s |
| Profile oxNew: | 0.00739s | 210.15% | 137 | * | 5.0E-5s |
| Profile oxAutoload: | 0.00303s | 86% | 83 | * | 4.0E-5s |
| Profile getArticleManufacturerUri: | 0.00126s | 35.68% | 7 | * | 0.00018s |
| Profile buildTree: | 0.00116s | 32.84% | 1 | * | 0.00116s |
| Profile parseThroughSmarty: | 0.00096s | 27.18% | 1 | * | 0.00096s |
| Profile loadinglists: | 0.0009s | 25.44% | 1 | * | 0.0009s |
| Profile _getAmountPrice: | 0.00087s | 24.76% | 7 | * | 0.00012s |
| Profile articleAssign: | 0.0003s | 8.59% | 7 | * | 4.0E-5s |
| Profile executeMaintenanceTasks: | 0.00029s | 8.33% | 1 | * | 0.00029s |
| Profile seoencoder_loadFromCache: | 0.00027s | 7.64% | 26 | * | 1.0E-5s |
| Profile smarty_function_oxmultilang: | 0.00015s | 4.15% | 46 | * | 0s |
| Profile _assignPriceInternal: | 0.00013s | 3.75% | 7 | * | 2.0E-5s |
| Profile _getLangTranslationArray: | 0.00012s | 3.44% | 61 | * | 0s |
| Profile fround: | 2.0E-5s | 0.45% | 53 | * | 0s |
| Profile _applyVAT: | 1.0E-5s | 0.31% | 14 | * | 0s |
| Profile isSearchEngine: | 1.0E-5s | 0.23% | 1 | * | 1.0E-5s |
| Profile generatePageNavigation: | 1.0E-5s | 0.22% | 2 | * | 0s |
| Profile oxviewconfig::getViewConfigParam: | 1.0E-5s | 0.2% | 27 | * | 0s |
| Profile oxviewconfig::setViewConfigParam: | 1.0E-5s | 0.16% | 28 | * | 0s |
| Profile articleAssignParentInternal: | 0s | 0.08% | 7 | * | 0s |
cl=oxwcategorytree(show/hide)
Memory usage: 3.487 MB (peak: 3.602 MB)
System memory usage: 2 MB (peak: 2 MB)
----------------------------------------------------------
System memory usage: 2 MB (peak: 2 MB)
Executed: 2024-06-11 03:44:56
Timestamp: 1718070296.7581
Execution time:0.0025----------------------------------------------------------
| Profile process: | 0.0147s | 578.61% | 13 | * | 0.00113s |
| Profile oxNew: | 0.008s | 314.71% | 142 | * | 6.0E-5s |
| Profile oxAutoload: | 0.00327s | 128.63% | 86 | * | 4.0E-5s |
| Profile getArticleManufacturerUri: | 0.00126s | 49.39% | 7 | * | 0.00018s |
| Profile buildTree: | 0.00116s | 45.46% | 1 | * | 0.00116s |
| Profile parseThroughSmarty: | 0.00096s | 37.62% | 1 | * | 0.00096s |
| Profile loadinglists: | 0.0009s | 35.22% | 1 | * | 0.0009s |
| Profile _getAmountPrice: | 0.00087s | 34.28% | 7 | * | 0.00012s |
| Profile seoencoder_loadFromCache: | 0.00054s | 21.07% | 42 | * | 1.0E-5s |
| Profile articleAssign: | 0.0003s | 11.89% | 7 | * | 4.0E-5s |
| Profile executeMaintenanceTasks: | 0.00029s | 11.53% | 1 | * | 0.00029s |
| Profile getCategoryUri: | 0.00025s | 9.65% | 14 | * | 2.0E-5s |
| Profile smarty_function_oxmultilang: | 0.00016s | 6.21% | 48 | * | 0s |
| Profile _assignPriceInternal: | 0.00013s | 5.19% | 7 | * | 2.0E-5s |
| Profile _getLangTranslationArray: | 0.00013s | 5.02% | 64 | * | 0s |
| Profile fround: | 2.0E-5s | 0.63% | 53 | * | 0s |
| Profile _applyVAT: | 1.0E-5s | 0.43% | 14 | * | 0s |
| Profile oxviewconfig::getViewConfigParam: | 1.0E-5s | 0.39% | 31 | * | 0s |
| Profile isSearchEngine: | 1.0E-5s | 0.32% | 1 | * | 1.0E-5s |
| Profile generatePageNavigation: | 1.0E-5s | 0.31% | 2 | * | 0s |
| Profile oxviewconfig::setViewConfigParam: | 1.0E-5s | 0.23% | 32 | * | 0s |
| Profile articleAssignParentInternal: | 0s | 0.11% | 7 | * | 0s |

cl=oxwminibasket(show/hide)
Memory usage: 3.526 MB (peak: 3.602 MB)
System memory usage: 2 MB (peak: 2 MB)
----------------------------------------------------------
System memory usage: 2 MB (peak: 2 MB)
Executed: 2024-06-11 03:44:56
Timestamp: 1718070296.7593
Execution time:0.0011----------------------------------------------------------
| Profile process: | 0.01585s | 1378.19% | 14 | * | 0.00113s |
| Profile oxNew: | 0.00817s | 710.57% | 145 | * | 6.0E-5s |
| Profile oxAutoload: | 0.00331s | 287.89% | 87 | * | 4.0E-5s |
| Profile getArticleManufacturerUri: | 0.00126s | 109.14% | 7 | * | 0.00018s |
| Profile buildTree: | 0.00116s | 100.46% | 1 | * | 0.00116s |
| Profile parseThroughSmarty: | 0.00096s | 83.14% | 1 | * | 0.00096s |
| Profile loadinglists: | 0.0009s | 77.84% | 1 | * | 0.0009s |
| Profile _getAmountPrice: | 0.00087s | 75.76% | 7 | * | 0.00012s |
| Profile seoencoder_loadFromCache: | 0.00054s | 46.57% | 42 | * | 1.0E-5s |
| Profile articleAssign: | 0.0003s | 26.27% | 7 | * | 4.0E-5s |
| Profile executeMaintenanceTasks: | 0.00029s | 25.48% | 1 | * | 0.00029s |
| Profile getCategoryUri: | 0.00025s | 21.34% | 14 | * | 2.0E-5s |
| Profile smarty_function_oxmultilang: | 0.00016s | 13.73% | 48 | * | 0s |
| Profile _assignPriceInternal: | 0.00013s | 11.47% | 7 | * | 2.0E-5s |
| Profile _getLangTranslationArray: | 0.00013s | 11.28% | 65 | * | 0s |
| Profile fround: | 2.0E-5s | 1.39% | 53 | * | 0s |
| Profile _applyVAT: | 1.0E-5s | 0.95% | 14 | * | 0s |
| Profile oxviewconfig::getViewConfigParam: | 1.0E-5s | 0.87% | 31 | * | 0s |
| Profile isSearchEngine: | 1.0E-5s | 0.7% | 1 | * | 1.0E-5s |
| Profile generatePageNavigation: | 1.0E-5s | 0.68% | 2 | * | 0s |
| Profile oxviewconfig::setViewConfigParam: | 1.0E-5s | 0.58% | 33 | * | 0s |
| Profile articleAssignParentInternal: | 0s | 0.25% | 7 | * | 0s |
Marke
cl=oxwcategorytree(show/hide)
Memory usage: 3.556 MB (peak: 3.602 MB)
System memory usage: 2 MB (peak: 2 MB)
----------------------------------------------------------
System memory usage: 2 MB (peak: 2 MB)
Executed: 2024-06-11 03:44:56
Timestamp: 1718070296.7601
Execution time:0.0003----------------------------------------------------------
| Profile process: | 0.0161s | 6242.05% | 15 | * | 0.00107s |
| Profile oxNew: | 0.00818s | 3169.32% | 148 | * | 6.0E-5s |
| Profile oxAutoload: | 0.00331s | 1283.27% | 87 | * | 4.0E-5s |
| Profile getArticleManufacturerUri: | 0.00126s | 486.51% | 7 | * | 0.00018s |
| Profile buildTree: | 0.00116s | 447.78% | 1 | * | 0.00116s |
| Profile parseThroughSmarty: | 0.00096s | 370.61% | 1 | * | 0.00096s |
| Profile loadinglists: | 0.0009s | 346.95% | 1 | * | 0.0009s |
| Profile _getAmountPrice: | 0.00087s | 337.71% | 7 | * | 0.00012s |
| Profile seoencoder_loadFromCache: | 0.00054s | 208.32% | 43 | * | 1.0E-5s |
| Profile articleAssign: | 0.0003s | 117.1% | 7 | * | 4.0E-5s |
| Profile executeMaintenanceTasks: | 0.00029s | 113.59% | 1 | * | 0.00029s |
| Profile getCategoryUri: | 0.00025s | 95.1% | 14 | * | 2.0E-5s |
| Profile smarty_function_oxmultilang: | 0.00016s | 63.96% | 50 | * | 0s |
| Profile _getLangTranslationArray: | 0.00013s | 51.94% | 69 | * | 0s |
| Profile _assignPriceInternal: | 0.00013s | 51.11% | 7 | * | 2.0E-5s |
| Profile fround: | 2.0E-5s | 6.19% | 53 | * | 0s |
| Profile _applyVAT: | 1.0E-5s | 4.25% | 14 | * | 0s |
| Profile oxviewconfig::getViewConfigParam: | 1.0E-5s | 4.25% | 33 | * | 0s |
| Profile isSearchEngine: | 1.0E-5s | 3.14% | 1 | * | 1.0E-5s |
| Profile generatePageNavigation: | 1.0E-5s | 3.05% | 2 | * | 0s |
| Profile oxviewconfig::setViewConfigParam: | 1.0E-5s | 2.59% | 36 | * | 0s |
| Profile articleAssignParentInternal: | 0s | 1.11% | 7 | * | 0s |
Tags
cl=oxwtagcloud(show/hide)
Memory usage: 3.694 MB (peak: 3.733 MB)
System memory usage: 2 MB (peak: 2 MB)
----------------------------------------------------------
System memory usage: 2 MB (peak: 2 MB)
Executed: 2024-06-11 03:44:56
Timestamp: 1718070296.7612
Execution time:0.001----------------------------------------------------------
| Profile process: | 0.01711s | 1686.16% | 16 | * | 0.00107s |
| Profile oxNew: | 0.00852s | 839.23% | 156 | * | 5.0E-5s |
| Profile oxAutoload: | 0.00363s | 357.22% | 93 | * | 4.0E-5s |
| Profile getArticleManufacturerUri: | 0.00126s | 123.66% | 7 | * | 0.00018s |
| Profile buildTree: | 0.00116s | 113.81% | 1 | * | 0.00116s |
| Profile parseThroughSmarty: | 0.00096s | 94.2% | 1 | * | 0.00096s |
| Profile loadinglists: | 0.0009s | 88.18% | 1 | * | 0.0009s |
| Profile _getAmountPrice: | 0.00087s | 85.84% | 7 | * | 0.00012s |
| Profile seoencoder_loadFromCache: | 0.00054s | 53.16% | 44 | * | 1.0E-5s |
| Profile articleAssign: | 0.0003s | 29.76% | 7 | * | 4.0E-5s |
| Profile executeMaintenanceTasks: | 0.00029s | 28.87% | 1 | * | 0.00029s |
| Profile getCategoryUri: | 0.00025s | 24.17% | 14 | * | 2.0E-5s |
| Profile smarty_function_oxmultilang: | 0.00017s | 17.03% | 52 | * | 0s |
| Profile _getLangTranslationArray: | 0.00014s | 13.67% | 73 | * | 0s |
| Profile _assignPriceInternal: | 0.00013s | 12.99% | 7 | * | 2.0E-5s |
| Profile fround: | 2.0E-5s | 1.57% | 53 | * | 0s |
| Profile _applyVAT: | 1.0E-5s | 1.08% | 14 | * | 0s |
| Profile oxviewconfig::getViewConfigParam: | 1.0E-5s | 1.08% | 34 | * | 0s |
| Profile isSearchEngine: | 1.0E-5s | 0.8% | 1 | * | 1.0E-5s |
| Profile generatePageNavigation: | 1.0E-5s | 0.78% | 2 | * | 0s |
| Profile oxviewconfig::setViewConfigParam: | 1.0E-5s | 0.66% | 38 | * | 0s |
| Profile articleAssignParentInternal: | 0s | 0.28% | 7 | * | 0s |
Liquid Force
-
Bindung LIQUID FORCE TRANSIT BOOT 2010
 259,00 € * In den Warenkorbcl=oxwarticlebox(show/hide)Memory usage: 2.811 MB (peak: 2.871 MB)
System memory usage: 2 MB (peak: 2 MB)Executed: 2024-06-11 03:44:56Timestamp: 1718070296.7425Execution time:0.0017
----------------------------------------------------------
Profile oxNew: 0.00657s 376.77% 79 * 8.0E-5s Profile oxAutoload: 0.00281s 161.39% 78 * 4.0E-5s Profile process: 0.00168s 96.21% 2 * 0.00084s Profile buildTree: 0.00116s 66.23% 1 * 0.00116s Profile loadinglists: 0.0009s 51.32% 1 * 0.0009s Profile articleAssign: 0.0003s 17.32% 7 * 4.0E-5s Profile executeMaintenanceTasks: 0.00029s 16.8% 1 * 0.00029s Profile _getAmountPrice: 0.00029s 16.51% 1 * 0.00029s Profile getArticleManufacturerUri: 0.00028s 16.23% 1 * 0.00028s Profile seoencoder_loadFromCache: 0.00019s 10.95% 15 * 1.0E-5s Profile _assignPriceInternal: 0.00011s 6.14% 1 * 0.00011s Profile _getLangTranslationArray: 7.0E-5s 3.96% 14 * 0s Profile smarty_function_oxmultilang: 3.0E-5s 1.8% 10 * 0s Profile fround: 1.0E-5s 0.63% 16 * 0s Profile isSearchEngine: 1.0E-5s 0.46% 1 * 1.0E-5s Profile generatePageNavigation: 0s 0.22% 1 * 0s Profile _applyVAT: 0s 0.18% 2 * 0s Profile articleAssignParentInternal: 0s 0.16% 7 * 0s Profile oxviewconfig::setViewConfigParam: 0s 0.05% 3 * 0s Profile oxviewconfig::getViewConfigParam: 0s 0.05% 5 * 0s -
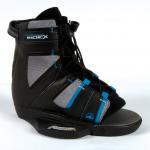
Bindung LIQUID FORCE INDEX BOOT 2010
 159,00 € * In den Warenkorbcl=oxwarticlebox(show/hide)Memory usage: 2.835 MB (peak: 2.898 MB)
System memory usage: 2 MB (peak: 2 MB)Executed: 2024-06-11 03:44:56Timestamp: 1718070296.7433Execution time:0.0007
----------------------------------------------------------
Profile oxNew: 0.00658s 944.25% 86 * 8.0E-5s Profile oxAutoload: 0.00281s 403.76% 78 * 4.0E-5s Profile process: 0.00237s 340.25% 3 * 0.00079s Profile buildTree: 0.00116s 165.7% 1 * 0.00116s Profile loadinglists: 0.0009s 128.39% 1 * 0.0009s Profile getArticleManufacturerUri: 0.0004s 57.97% 2 * 0.0002s Profile _getAmountPrice: 0.0004s 57.66% 2 * 0.0002s Profile articleAssign: 0.0003s 43.33% 7 * 4.0E-5s Profile executeMaintenanceTasks: 0.00029s 42.03% 1 * 0.00029s Profile seoencoder_loadFromCache: 0.00019s 27.53% 16 * 1.0E-5s Profile _assignPriceInternal: 0.00011s 15.77% 2 * 5.0E-5s Profile _getLangTranslationArray: 7.0E-5s 10.36% 17 * 0s Profile smarty_function_oxmultilang: 4.0E-5s 5.51% 12 * 0s Profile fround: 1.0E-5s 1.71% 22 * 0s Profile isSearchEngine: 1.0E-5s 1.16% 1 * 1.0E-5s Profile _applyVAT: 1.0E-5s 0.72% 4 * 0s Profile generatePageNavigation: 0s 0.55% 1 * 0s Profile articleAssignParentInternal: 0s 0.41% 7 * 0s Profile oxviewconfig::setViewConfigParam: 0s 0.14% 5 * 0s Profile oxviewconfig::getViewConfigParam: 0s 0.14% 6 * 0s -
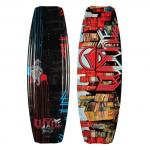
Wakeboard LIQUID FORCE SHANE 2010
 389,00 € * In den Warenkorbcl=oxwarticlebox(show/hide)Memory usage: 2.874 MB (peak: 2.938 MB)
System memory usage: 2 MB (peak: 2 MB)Executed: 2024-06-11 03:44:56Timestamp: 1718070296.744Execution time:0.0007
----------------------------------------------------------
Profile oxNew: 0.00659s 948.92% 93 * 7.0E-5s Profile process: 0.00306s 440.72% 4 * 0.00077s Profile oxAutoload: 0.00281s 405.01% 78 * 4.0E-5s Profile buildTree: 0.00116s 166.21% 1 * 0.00116s Profile loadinglists: 0.0009s 128.78% 1 * 0.0009s Profile getArticleManufacturerUri: 0.00056s 80.58% 3 * 0.00019s Profile _getAmountPrice: 0.00049s 71.08% 3 * 0.00016s Profile articleAssign: 0.0003s 43.46% 7 * 4.0E-5s Profile executeMaintenanceTasks: 0.00029s 42.16% 1 * 0.00029s Profile seoencoder_loadFromCache: 0.00019s 27.89% 17 * 1.0E-5s Profile _assignPriceInternal: 0.00011s 16.4% 3 * 4.0E-5s Profile _getLangTranslationArray: 8.0E-5s 10.81% 20 * 0s Profile smarty_function_oxmultilang: 5.0E-5s 6.55% 14 * 0s Profile fround: 1.0E-5s 1.72% 28 * 0s Profile isSearchEngine: 1.0E-5s 1.17% 1 * 1.0E-5s Profile _applyVAT: 1.0E-5s 1.03% 6 * 0s Profile generatePageNavigation: 0s 0.55% 1 * 0s Profile articleAssignParentInternal: 0s 0.41% 7 * 0s Profile oxviewconfig::setViewConfigParam: 0s 0.14% 7 * 0s Profile oxviewconfig::getViewConfigParam: 0s 0.14% 7 * 0s -
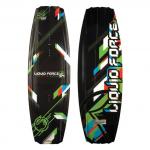
Wakeboard LIQUID FORCE GROOVE 2010
 cl=oxwarticlebox(show/hide)Memory usage: 2.914 MB (peak: 2.979 MB)
System memory usage: 2 MB (peak: 2 MB)Executed: 2024-06-11 03:44:56Timestamp: 1718070296.7447Execution time:0.0007
----------------------------------------------------------
Profile oxNew: 0.00661s 943.1% 100 * 7.0E-5s Profile process: 0.00376s 536.39% 5 * 0.00075s Profile oxAutoload: 0.00281s 401.56% 78 * 4.0E-5s Profile buildTree: 0.00116s 164.8% 1 * 0.00116s Profile loadinglists: 0.0009s 127.69% 1 * 0.0009s Profile getArticleManufacturerUri: 0.00071s 101.7% 4 * 0.00018s Profile _getAmountPrice: 0.00059s 83.47% 4 * 0.00015s Profile articleAssign: 0.0003s 43.1% 7 * 4.0E-5s Profile executeMaintenanceTasks: 0.00029s 41.8% 1 * 0.00029s Profile seoencoder_loadFromCache: 0.00019s 27.79% 18 * 1.0E-5s Profile _assignPriceInternal: 0.00012s 16.84% 4 * 3.0E-5s Profile _getLangTranslationArray: 8.0E-5s 11.36% 24 * 0s Profile smarty_function_oxmultilang: 5.0E-5s 7.79% 17 * 0s Profile fround: 1.0E-5s 1.97% 35 * 0s Profile isSearchEngine: 1.0E-5s 1.16% 1 * 1.0E-5s Profile _applyVAT: 1.0E-5s 1.02% 8 * 0s Profile generatePageNavigation: 0s 0.54% 1 * 0s Profile articleAssignParentInternal: 0s 0.41% 7 * 0s Profile oxviewconfig::getViewConfigParam: 0s 0.27% 8 * 0s Profile oxviewconfig::setViewConfigParam: 0s 0.14% 9 * 0s -
Wakeboard LIQUID FORCE S4 2010
 389,00 € * In den Warenkorbcl=oxwarticlebox(show/hide)Memory usage: 2.954 MB (peak: 3.002 MB)
System memory usage: 2 MB (peak: 2 MB)Executed: 2024-06-11 03:44:56Timestamp: 1718070296.7455Execution time:0.0007
----------------------------------------------------------
Profile oxNew: 0.00662s 968.21% 107 * 6.0E-5s Profile process: 0.00444s 649.08% 6 * 0.00074s Profile oxAutoload: 0.00281s 411.5% 78 * 4.0E-5s Profile buildTree: 0.00116s 168.87% 1 * 0.00116s Profile loadinglists: 0.0009s 130.85% 1 * 0.0009s Profile getArticleManufacturerUri: 0.00086s 126% 5 * 0.00017s Profile _getAmountPrice: 0.00067s 97.98% 5 * 0.00013s Profile articleAssign: 0.0003s 44.16% 7 * 4.0E-5s Profile executeMaintenanceTasks: 0.00029s 42.84% 1 * 0.00029s Profile seoencoder_loadFromCache: 0.0002s 28.79% 19 * 1.0E-5s Profile _assignPriceInternal: 0.00012s 17.81% 5 * 2.0E-5s Profile _getLangTranslationArray: 8.0E-5s 11.92% 27 * 0s Profile smarty_function_oxmultilang: 6.0E-5s 8.71% 19 * 0s Profile fround: 1.0E-5s 2.02% 41 * 0s Profile isSearchEngine: 1.0E-5s 1.19% 1 * 1.0E-5s Profile _applyVAT: 1.0E-5s 1.19% 10 * 0s Profile generatePageNavigation: 0s 0.56% 1 * 0s Profile articleAssignParentInternal: 0s 0.42% 7 * 0s Profile oxviewconfig::getViewConfigParam: 0s 0.28% 9 * 0s Profile oxviewconfig::setViewConfigParam: 0s 0.14% 11 * 0s -
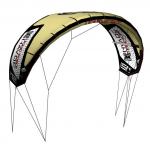
Kite LIQUID FORCE ENVY
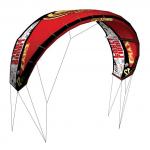 1.019,00 € * In den Warenkorbcl=oxwarticlebox(show/hide)Memory usage: 2.978 MB (peak: 3.042 MB)
System memory usage: 2 MB (peak: 2 MB)Executed: 2024-06-11 03:44:56Timestamp: 1718070296.7462Execution time:0.0007
----------------------------------------------------------
Profile oxNew: 0.00664s 968.74% 114 * 6.0E-5s Profile process: 0.00512s 747.62% 7 * 0.00073s Profile oxAutoload: 0.00281s 410.93% 78 * 4.0E-5s Profile buildTree: 0.00116s 168.64% 1 * 0.00116s Profile getArticleManufacturerUri: 0.00103s 150.23% 6 * 0.00017s Profile loadinglists: 0.0009s 130.66% 1 * 0.0009s Profile _getAmountPrice: 0.00074s 108.49% 6 * 0.00012s Profile articleAssign: 0.0003s 44.1% 7 * 4.0E-5s Profile executeMaintenanceTasks: 0.00029s 42.78% 1 * 0.00029s Profile seoencoder_loadFromCache: 0.0002s 28.92% 20 * 1.0E-5s Profile _assignPriceInternal: 0.00013s 18.38% 6 * 2.0E-5s Profile _getLangTranslationArray: 8.0E-5s 12.32% 30 * 0s Profile smarty_function_oxmultilang: 6.0E-5s 9.47% 21 * 0s Profile fround: 1.0E-5s 2.02% 47 * 0s Profile _applyVAT: 1.0E-5s 1.32% 12 * 0s Profile isSearchEngine: 1.0E-5s 1.18% 1 * 1.0E-5s Profile generatePageNavigation: 0s 0.56% 1 * 0s Profile articleAssignParentInternal: 0s 0.42% 7 * 0s Profile oxviewconfig::getViewConfigParam: 0s 0.28% 10 * 0s Profile oxviewconfig::setViewConfigParam: 0s 0.14% 13 * 0s -
Kite LIQUID FORCE HAVOC
 1.189,00 € * In den Warenkorbcl=oxwarticlebox(show/hide)Memory usage: 3.018 MB (peak: 3.081 MB)
System memory usage: 2 MB (peak: 2 MB)Executed: 2024-06-11 03:44:56Timestamp: 1718070296.7472Execution time:0.001
----------------------------------------------------------
Profile oxNew: 0.00666s 677.15% 121 * 6.0E-5s Profile process: 0.0061s 620.23% 8 * 0.00076s Profile oxAutoload: 0.00281s 286.34% 78 * 4.0E-5s Profile getArticleManufacturerUri: 0.00126s 127.67% 7 * 0.00018s Profile buildTree: 0.00116s 117.51% 1 * 0.00116s Profile loadinglists: 0.0009s 91.05% 1 * 0.0009s Profile _getAmountPrice: 0.00087s 88.62% 7 * 0.00012s Profile articleAssign: 0.0003s 30.73% 7 * 4.0E-5s Profile executeMaintenanceTasks: 0.00029s 29.81% 1 * 0.00029s Profile seoencoder_loadFromCache: 0.00021s 21.05% 21 * 1.0E-5s Profile _assignPriceInternal: 0.00013s 13.41% 7 * 2.0E-5s Profile _getLangTranslationArray: 9.0E-5s 9.1% 33 * 0s Profile smarty_function_oxmultilang: 8.0E-5s 7.71% 23 * 0s Profile fround: 2.0E-5s 1.63% 53 * 0s Profile _applyVAT: 1.0E-5s 1.12% 14 * 0s Profile isSearchEngine: 1.0E-5s 0.82% 1 * 1.0E-5s Profile generatePageNavigation: 0s 0.39% 1 * 0s Profile articleAssignParentInternal: 0s 0.29% 7 * 0s Profile oxviewconfig::setViewConfigParam: 0s 0.29% 15 * 0s Profile oxviewconfig::getViewConfigParam: 0s 0.19% 11 * 0s
cl=oxwservicelist(show/hide)
Memory usage: 3.842 MB (peak: 3.877 MB)
System memory usage: 4 MB (peak: 4 MB)
----------------------------------------------------------
System memory usage: 4 MB (peak: 4 MB)
Executed: 2024-06-11 03:44:56
Timestamp: 1718070296.7632
Execution time:0.0011----------------------------------------------------------
| Profile process: | 0.01819s | 1670.45% | 17 | * | 0.00107s |
| Profile oxNew: | 0.00861s | 790.56% | 161 | * | 5.0E-5s |
| Profile oxAutoload: | 0.00365s | 334.83% | 94 | * | 4.0E-5s |
| Profile getArticleManufacturerUri: | 0.00126s | 115.24% | 7 | * | 0.00018s |
| Profile buildTree: | 0.00116s | 106.06% | 1 | * | 0.00116s |
| Profile parseThroughSmarty: | 0.00096s | 87.78% | 1 | * | 0.00096s |
| Profile loadinglists: | 0.0009s | 82.18% | 1 | * | 0.0009s |
| Profile _getAmountPrice: | 0.00087s | 79.99% | 7 | * | 0.00012s |
| Profile seoencoder_loadFromCache: | 0.00055s | 50.35% | 50 | * | 1.0E-5s |
| Profile articleAssign: | 0.0003s | 27.74% | 7 | * | 4.0E-5s |
| Profile executeMaintenanceTasks: | 0.00029s | 26.9% | 1 | * | 0.00029s |
| Profile getCategoryUri: | 0.00025s | 22.53% | 14 | * | 2.0E-5s |
| Profile smarty_function_oxmultilang: | 0.00022s | 20.14% | 65 | * | 0s |
| Profile _getLangTranslationArray: | 0.00016s | 14.25% | 87 | * | 0s |
| Profile _assignPriceInternal: | 0.00013s | 12.11% | 7 | * | 2.0E-5s |
| Profile fround: | 2.0E-5s | 1.47% | 53 | * | 0s |
| Profile oxviewconfig::getViewConfigParam: | 1.0E-5s | 1.18% | 43 | * | 0s |
| Profile _applyVAT: | 1.0E-5s | 1.01% | 14 | * | 0s |
| Profile oxviewconfig::setViewConfigParam: | 1.0E-5s | 0.88% | 43 | * | 0s |
| Profile isSearchEngine: | 1.0E-5s | 0.74% | 1 | * | 1.0E-5s |
| Profile generatePageNavigation: | 1.0E-5s | 0.72% | 2 | * | 0s |
| Profile articleAssignParentInternal: | 0s | 0.26% | 7 | * | 0s |
cl=oxwinformation(show/hide)
Memory usage: 3.941 MB (peak: 3.961 MB)
System memory usage: 4 MB (peak: 4 MB)
----------------------------------------------------------
System memory usage: 4 MB (peak: 4 MB)
Executed: 2024-06-11 03:44:56
Timestamp: 1718070296.7645
Execution time:0.0013----------------------------------------------------------
| Profile process: | 0.01944s | 1545.66% | 18 | * | 0.00108s |
| Profile oxNew: | 0.0088s | 699.45% | 166 | * | 5.0E-5s |
| Profile oxAutoload: | 0.00369s | 293.31% | 95 | * | 4.0E-5s |
| Profile getArticleManufacturerUri: | 0.00126s | 99.77% | 7 | * | 0.00018s |
| Profile buildTree: | 0.00116s | 91.83% | 1 | * | 0.00116s |
| Profile parseThroughSmarty: | 0.00096s | 76% | 1 | * | 0.00096s |
| Profile loadinglists: | 0.0009s | 71.15% | 1 | * | 0.0009s |
| Profile _getAmountPrice: | 0.00087s | 69.26% | 7 | * | 0.00012s |
| Profile seoencoder_loadFromCache: | 0.00056s | 44.26% | 57 | * | 1.0E-5s |
| Profile articleAssign: | 0.0003s | 24.01% | 7 | * | 4.0E-5s |
| Profile executeMaintenanceTasks: | 0.00029s | 23.29% | 1 | * | 0.00029s |
| Profile getCategoryUri: | 0.00025s | 19.5% | 14 | * | 2.0E-5s |
| Profile smarty_function_oxmultilang: | 0.00023s | 18.56% | 67 | * | 0s |
| Profile _getLangTranslationArray: | 0.00016s | 12.89% | 90 | * | 0s |
| Profile _assignPriceInternal: | 0.00013s | 10.48% | 7 | * | 2.0E-5s |
| Profile fround: | 2.0E-5s | 1.27% | 53 | * | 0s |
| Profile oxviewconfig::getViewConfigParam: | 1.0E-5s | 1.1% | 44 | * | 0s |
| Profile _applyVAT: | 1.0E-5s | 0.87% | 14 | * | 0s |
| Profile oxviewconfig::setViewConfigParam: | 1.0E-5s | 0.76% | 45 | * | 0s |
| Profile isSearchEngine: | 1.0E-5s | 0.64% | 1 | * | 1.0E-5s |
| Profile generatePageNavigation: | 1.0E-5s | 0.63% | 2 | * | 0s |
| Profile articleAssignParentInternal: | 0s | 0.23% | 7 | * | 0s |
cl=oxwmanufacturerlist(show/hide)
Memory usage: 3.998 MB (peak: 4.015 MB)
System memory usage: 4 MB (peak: 4 MB)
----------------------------------------------------------
System memory usage: 4 MB (peak: 4 MB)
Executed: 2024-06-11 03:44:56
Timestamp: 1718070296.7655
Execution time:0.001----------------------------------------------------------
| Profile process: | 0.0204s | 2113.81% | 19 | * | 0.00107s |
| Profile oxNew: | 0.00898s | 930.46% | 169 | * | 5.0E-5s |
| Profile oxAutoload: | 0.00373s | 386.83% | 96 | * | 4.0E-5s |
| Profile getArticleManufacturerUri: | 0.00126s | 130.04% | 7 | * | 0.00018s |
| Profile buildTree: | 0.00116s | 119.69% | 1 | * | 0.00116s |
| Profile parseThroughSmarty: | 0.00096s | 99.06% | 1 | * | 0.00096s |
| Profile loadinglists: | 0.0009s | 92.74% | 1 | * | 0.0009s |
| Profile _getAmountPrice: | 0.00087s | 90.27% | 7 | * | 0.00012s |
| Profile seoencoder_loadFromCache: | 0.00057s | 58.79% | 67 | * | 1.0E-5s |
| Profile articleAssign: | 0.0003s | 31.3% | 7 | * | 4.0E-5s |
| Profile executeMaintenanceTasks: | 0.00029s | 30.36% | 1 | * | 0.00029s |
| Profile getCategoryUri: | 0.00025s | 25.42% | 14 | * | 2.0E-5s |
| Profile smarty_function_oxmultilang: | 0.00024s | 25.22% | 69 | * | 0s |
| Profile _getLangTranslationArray: | 0.00017s | 17.42% | 93 | * | 0s |
| Profile _assignPriceInternal: | 0.00013s | 13.66% | 7 | * | 2.0E-5s |
| Profile fround: | 2.0E-5s | 1.66% | 53 | * | 0s |
| Profile oxviewconfig::getViewConfigParam: | 1.0E-5s | 1.43% | 44 | * | 0s |
| Profile _applyVAT: | 1.0E-5s | 1.14% | 14 | * | 0s |
| Profile oxviewconfig::setViewConfigParam: | 1.0E-5s | 1.09% | 46 | * | 0s |
| Profile isSearchEngine: | 1.0E-5s | 0.84% | 1 | * | 1.0E-5s |
| Profile generatePageNavigation: | 1.0E-5s | 0.82% | 2 | * | 0s |
| Profile articleAssignParentInternal: | 0s | 0.3% | 7 | * | 0s |
cl=oxwcategorytree(show/hide)
Memory usage: 4.025 MB (peak: 4.042 MB)
System memory usage: 4 MB (peak: 4 MB)
----------------------------------------------------------
System memory usage: 4 MB (peak: 4 MB)
Executed: 2024-06-11 03:44:56
Timestamp: 1718070296.7662
Execution time:0.0006----------------------------------------------------------
| Profile process: | 0.02099s | 3510.61% | 20 | * | 0.00105s |
| Profile oxNew: | 0.00899s | 1503.27% | 172 | * | 5.0E-5s |
| Profile oxAutoload: | 0.00373s | 624.36% | 96 | * | 4.0E-5s |
| Profile getArticleManufacturerUri: | 0.00126s | 209.89% | 7 | * | 0.00018s |
| Profile buildTree: | 0.00116s | 193.18% | 1 | * | 0.00116s |
| Profile parseThroughSmarty: | 0.00096s | 159.89% | 1 | * | 0.00096s |
| Profile loadinglists: | 0.0009s | 149.68% | 1 | * | 0.0009s |
| Profile _getAmountPrice: | 0.00087s | 145.69% | 7 | * | 0.00012s |
| Profile seoencoder_loadFromCache: | 0.00057s | 94.9% | 67 | * | 1.0E-5s |
| Profile articleAssign: | 0.0003s | 50.52% | 7 | * | 4.0E-5s |
| Profile executeMaintenanceTasks: | 0.00029s | 49% | 1 | * | 0.00029s |
| Profile smarty_function_oxmultilang: | 0.00025s | 41.91% | 70 | * | 0s |
| Profile getCategoryUri: | 0.00025s | 41.03% | 14 | * | 2.0E-5s |
| Profile _getLangTranslationArray: | 0.00017s | 28.95% | 95 | * | 0s |
| Profile _assignPriceInternal: | 0.00013s | 22.05% | 7 | * | 2.0E-5s |
| Profile fround: | 2.0E-5s | 2.67% | 53 | * | 0s |
| Profile oxviewconfig::getViewConfigParam: | 1.0E-5s | 2.31% | 44 | * | 0s |
| Profile oxviewconfig::setViewConfigParam: | 1.0E-5s | 1.91% | 47 | * | 0s |
| Profile _applyVAT: | 1.0E-5s | 1.83% | 14 | * | 0s |
| Profile isSearchEngine: | 1.0E-5s | 1.36% | 1 | * | 1.0E-5s |
| Profile generatePageNavigation: | 1.0E-5s | 1.32% | 2 | * | 0s |
| Profile articleAssignParentInternal: | 0s | 0.48% | 7 | * | 0s |
oxidresponsive.com - Responsive Templates & Designs für OXID Onlineshops. Weitere Informationen, Preise & Bestellen