ärmellos
träger
shirt
pima
lässig
longsleeve
locker
liquid force
langarm
kuyichi
kurz
kiteboarding
kiteboard
kite
jeans
gerade
dunkel
board
anna
2010
Mehr...
cl=oxwcookienote(show/hide)
Memory usage: 3.159 MB (peak: 3.195 MB)
System memory usage: 2 MB (peak: 2 MB)
Execution time:0.0004
----------------------------------------------------------
System memory usage: 2 MB (peak: 2 MB)
Execution time:0.0004
----------------------------------------------------------
| Profile oxNew: | 0.01132s | 3135.01% | 124 | * | 9.0E-5s |
| Profile process: | 0.00721s | 1996.83% | 9 | * | 0.0008s |
| Profile oxAutoload: | 0.00459s | 1272.32% | 79 | * | 6.0E-5s |
| Profile buildTree: | 0.00173s | 479.79% | 1 | * | 0.00173s |
| Profile loadinglists: | 0.0014s | 387.85% | 1 | * | 0.0014s |
| Profile getArticleManufacturerUri: | 0.00137s | 378.93% | 7 | * | 0.0002s |
| Profile _getAmountPrice: | 0.00094s | 260.3% | 7 | * | 0.00013s |
| Profile articleAssign: | 0.00057s | 157.07% | 7 | * | 8.0E-5s |
| Profile seoencoder_loadFromCache: | 0.00034s | 93.26% | 21 | * | 2.0E-5s |
| Profile executeMaintenanceTasks: | 0.0003s | 83.69% | 1 | * | 0.0003s |
| Profile _assignPriceInternal: | 0.00019s | 52.44% | 7 | * | 3.0E-5s |
| Profile _getLangTranslationArray: | 0.00014s | 38.97% | 34 | * | 0s |
| Profile smarty_function_oxmultilang: | 6.0E-5s | 17.5% | 23 | * | 0s |
| Profile fround: | 2.0E-5s | 5.55% | 53 | * | 0s |
| Profile _applyVAT: | 1.0E-5s | 2.51% | 14 | * | 0s |
| Profile articleAssignParentInternal: | 1.0E-5s | 2.25% | 7 | * | 0s |
| Profile isSearchEngine: | 1.0E-5s | 1.92% | 1 | * | 1.0E-5s |
| Profile generatePageNavigation: | 1.0E-5s | 1.65% | 2 | * | 0s |
| Profile oxviewconfig::setViewConfigParam: | 0s | 0.53% | 16 | * | 0s |
| Profile oxviewconfig::getViewConfigParam: | 0s | 0.26% | 11 | * | 0s |
cl=oxwlanguagelist(show/hide)
Memory usage: 3.198 MB (peak: 3.245 MB)
System memory usage: 2 MB (peak: 2 MB)
----------------------------------------------------------
System memory usage: 2 MB (peak: 2 MB)
Executed: 2024-06-09 14:25:27
Timestamp: 1717935927.9962
Execution time:0.0006----------------------------------------------------------
| Profile oxNew: | 0.01139s | 2009.59% | 127 | * | 9.0E-5s |
| Profile process: | 0.00777s | 1370.65% | 10 | * | 0.00078s |
| Profile oxAutoload: | 0.00461s | 813.58% | 80 | * | 6.0E-5s |
| Profile buildTree: | 0.00173s | 305.47% | 1 | * | 0.00173s |
| Profile loadinglists: | 0.0014s | 246.93% | 1 | * | 0.0014s |
| Profile getArticleManufacturerUri: | 0.00137s | 241.25% | 7 | * | 0.0002s |
| Profile _getAmountPrice: | 0.00094s | 165.73% | 7 | * | 0.00013s |
| Profile articleAssign: | 0.00057s | 100% | 7 | * | 8.0E-5s |
| Profile seoencoder_loadFromCache: | 0.00034s | 59.38% | 21 | * | 2.0E-5s |
| Profile executeMaintenanceTasks: | 0.0003s | 53.28% | 1 | * | 0.0003s |
| Profile _assignPriceInternal: | 0.00019s | 33.39% | 7 | * | 3.0E-5s |
| Profile _getLangTranslationArray: | 0.00014s | 25.15% | 35 | * | 0s |
| Profile smarty_function_oxmultilang: | 6.0E-5s | 11.14% | 23 | * | 0s |
| Profile fround: | 2.0E-5s | 3.53% | 53 | * | 0s |
| Profile _applyVAT: | 1.0E-5s | 1.6% | 14 | * | 0s |
| Profile articleAssignParentInternal: | 1.0E-5s | 1.43% | 7 | * | 0s |
| Profile isSearchEngine: | 1.0E-5s | 1.22% | 1 | * | 1.0E-5s |
| Profile generatePageNavigation: | 1.0E-5s | 1.05% | 2 | * | 0s |
| Profile oxviewconfig::setViewConfigParam: | 0s | 0.34% | 19 | * | 0s |
| Profile oxviewconfig::getViewConfigParam: | 0s | 0.17% | 13 | * | 0s |
cl=oxwcurrencylist(show/hide)
Memory usage: 3.249 MB (peak: 3.296 MB)
System memory usage: 2 MB (peak: 2 MB)
----------------------------------------------------------
System memory usage: 2 MB (peak: 2 MB)
Executed: 2024-06-09 14:25:27
Timestamp: 1717935927.9967
Execution time:0.0004----------------------------------------------------------
| Profile oxNew: | 0.01147s | 2649.12% | 130 | * | 9.0E-5s |
| Profile process: | 0.0082s | 1894.11% | 11 | * | 0.00075s |
| Profile oxAutoload: | 0.00463s | 1069.99% | 81 | * | 6.0E-5s |
| Profile buildTree: | 0.00173s | 400% | 1 | * | 0.00173s |
| Profile loadinglists: | 0.0014s | 323.35% | 1 | * | 0.0014s |
| Profile getArticleManufacturerUri: | 0.00137s | 315.91% | 7 | * | 0.0002s |
| Profile _getAmountPrice: | 0.00094s | 217.02% | 7 | * | 0.00013s |
| Profile articleAssign: | 0.00057s | 130.95% | 7 | * | 8.0E-5s |
| Profile seoencoder_loadFromCache: | 0.00034s | 77.75% | 21 | * | 2.0E-5s |
| Profile executeMaintenanceTasks: | 0.0003s | 69.77% | 1 | * | 0.0003s |
| Profile _assignPriceInternal: | 0.00019s | 43.72% | 7 | * | 3.0E-5s |
| Profile _getLangTranslationArray: | 0.00014s | 33.37% | 36 | * | 0s |
| Profile smarty_function_oxmultilang: | 6.0E-5s | 14.59% | 23 | * | 0s |
| Profile fround: | 2.0E-5s | 4.63% | 53 | * | 0s |
| Profile _applyVAT: | 1.0E-5s | 2.09% | 14 | * | 0s |
| Profile articleAssignParentInternal: | 1.0E-5s | 1.87% | 7 | * | 0s |
| Profile isSearchEngine: | 1.0E-5s | 1.6% | 1 | * | 1.0E-5s |
| Profile generatePageNavigation: | 1.0E-5s | 1.38% | 2 | * | 0s |
| Profile oxviewconfig::setViewConfigParam: | 0s | 0.44% | 21 | * | 0s |
| Profile oxviewconfig::getViewConfigParam: | 0s | 0.22% | 14 | * | 0s |
-
Anmelden
 Sie haben Ihr Passwort vergessen?
Kein Problem! Hier können Sie ein neues Passwort einrichten.
Sie erhalten eine E-Mail mit einem Link, um ein neues Passwort zu vergeben.
Sollten Sie innerhalb der nächsten Minuten KEINE E-Mail mit Ihren Zugangsdaten erhalten, so überprüfen Sie bitte: Haben Sie sich in unserem Shop bereits registriert? Wenn nicht, so tun Sie dies bitte einmalig im Rahmen des Bestellprozesses. Sie können dann selbst ein Passwort festlegen. Sobald Sie registriert sind, können Sie sich in Zukunft mit Ihrer E-Mail-Adresse und Ihrem Passwort einloggen.- Wenn Sie sich sicher sind, dass Sie sich in unserem Shop bereits registriert haben, dann überprüfen Sie bitte, ob Sie sich bei der Eingabe Ihrer E-Mail-Adresse evtl. vertippt haben.
Sollten Sie trotz korrekter E-Mail-Adresse und bereits bestehender Registrierung weiterhin Probleme mit dem Login haben und auch keine "Passwort vergessen"-E-Mail erhalten, so wenden Sie sich bitte per E-Mail an:
- Registrieren
cl=oxwservicemenu(show/hide)
Memory usage: 3.439 MB (peak: 3.602 MB)
System memory usage: 2 MB (peak: 2 MB)
Execution time:0.0029
----------------------------------------------------------
System memory usage: 2 MB (peak: 2 MB)
Execution time:0.0029
----------------------------------------------------------
| Profile oxNew: | 0.01166s | 401.78% | 137 | * | 9.0E-5s |
| Profile process: | 0.0111s | 382.29% | 12 | * | 0.00092s |
| Profile oxAutoload: | 0.00471s | 162.28% | 83 | * | 6.0E-5s |
| Profile buildTree: | 0.00173s | 59.66% | 1 | * | 0.00173s |
| Profile loadinglists: | 0.0014s | 48.23% | 1 | * | 0.0014s |
| Profile getArticleManufacturerUri: | 0.00137s | 47.12% | 7 | * | 0.0002s |
| Profile _getAmountPrice: | 0.00094s | 32.37% | 7 | * | 0.00013s |
| Profile parseThroughSmarty: | 0.00075s | 25.98% | 1 | * | 0.00075s |
| Profile articleAssign: | 0.00057s | 19.53% | 7 | * | 8.0E-5s |
| Profile seoencoder_loadFromCache: | 0.0004s | 13.69% | 26 | * | 2.0E-5s |
| Profile executeMaintenanceTasks: | 0.0003s | 10.41% | 1 | * | 0.0003s |
| Profile _assignPriceInternal: | 0.00019s | 6.52% | 7 | * | 3.0E-5s |
| Profile _getLangTranslationArray: | 0.00016s | 5.5% | 61 | * | 0s |
| Profile smarty_function_oxmultilang: | 0.00011s | 3.77% | 46 | * | 0s |
| Profile fround: | 2.0E-5s | 0.69% | 53 | * | 0s |
| Profile _applyVAT: | 1.0E-5s | 0.31% | 14 | * | 0s |
| Profile articleAssignParentInternal: | 1.0E-5s | 0.28% | 7 | * | 0s |
| Profile isSearchEngine: | 1.0E-5s | 0.24% | 1 | * | 1.0E-5s |
| Profile generatePageNavigation: | 1.0E-5s | 0.21% | 2 | * | 0s |
| Profile oxviewconfig::setViewConfigParam: | 0s | 0.13% | 28 | * | 0s |
| Profile oxviewconfig::getViewConfigParam: | 0s | 0.1% | 27 | * | 0s |
cl=oxwcategorytree(show/hide)
Memory usage: 3.489 MB (peak: 3.602 MB)
System memory usage: 2 MB (peak: 2 MB)
----------------------------------------------------------
System memory usage: 2 MB (peak: 2 MB)
Executed: 2024-06-09 14:25:28
Timestamp: 1717935928.001
Execution time:0.0012----------------------------------------------------------
| Profile process: | 0.01233s | 994.77% | 13 | * | 0.00095s |
| Profile oxNew: | 0.01195s | 963.75% | 142 | * | 8.0E-5s |
| Profile oxAutoload: | 0.00483s | 389.42% | 86 | * | 6.0E-5s |
| Profile buildTree: | 0.00173s | 139.69% | 1 | * | 0.00173s |
| Profile loadinglists: | 0.0014s | 112.92% | 1 | * | 0.0014s |
| Profile getArticleManufacturerUri: | 0.00137s | 110.33% | 7 | * | 0.0002s |
| Profile _getAmountPrice: | 0.00094s | 75.79% | 7 | * | 0.00013s |
| Profile parseThroughSmarty: | 0.00075s | 60.83% | 1 | * | 0.00075s |
| Profile articleAssign: | 0.00057s | 45.73% | 7 | * | 8.0E-5s |
| Profile seoencoder_loadFromCache: | 0.00052s | 42.12% | 42 | * | 1.0E-5s |
| Profile executeMaintenanceTasks: | 0.0003s | 24.37% | 1 | * | 0.0003s |
| Profile _assignPriceInternal: | 0.00019s | 15.27% | 7 | * | 3.0E-5s |
| Profile _getLangTranslationArray: | 0.00016s | 13.12% | 64 | * | 0s |
| Profile getCategoryUri: | 0.00012s | 9.4% | 14 | * | 1.0E-5s |
| Profile smarty_function_oxmultilang: | 0.00012s | 9.29% | 48 | * | 0s |
| Profile fround: | 2.0E-5s | 1.62% | 53 | * | 0s |
| Profile _applyVAT: | 1.0E-5s | 0.73% | 14 | * | 0s |
| Profile articleAssignParentInternal: | 1.0E-5s | 0.65% | 7 | * | 0s |
| Profile isSearchEngine: | 1.0E-5s | 0.56% | 1 | * | 1.0E-5s |
| Profile generatePageNavigation: | 1.0E-5s | 0.48% | 2 | * | 0s |
| Profile oxviewconfig::setViewConfigParam: | 0s | 0.38% | 32 | * | 0s |
| Profile oxviewconfig::getViewConfigParam: | 0s | 0.38% | 31 | * | 0s |

cl=oxwminibasket(show/hide)
Memory usage: 3.543 MB (peak: 3.602 MB)
System memory usage: 2 MB (peak: 2 MB)
----------------------------------------------------------
System memory usage: 2 MB (peak: 2 MB)
Executed: 2024-06-09 14:25:28
Timestamp: 1717935928.002
Execution time:0.001----------------------------------------------------------
| Profile process: | 0.01332s | 1341.46% | 14 | * | 0.00095s |
| Profile oxNew: | 0.01204s | 1212% | 145 | * | 8.0E-5s |
| Profile oxAutoload: | 0.00485s | 488.31% | 87 | * | 6.0E-5s |
| Profile buildTree: | 0.00173s | 174.41% | 1 | * | 0.00173s |
| Profile loadinglists: | 0.0014s | 140.98% | 1 | * | 0.0014s |
| Profile getArticleManufacturerUri: | 0.00137s | 137.74% | 7 | * | 0.0002s |
| Profile _getAmountPrice: | 0.00094s | 94.62% | 7 | * | 0.00013s |
| Profile parseThroughSmarty: | 0.00075s | 75.94% | 1 | * | 0.00075s |
| Profile articleAssign: | 0.00057s | 57.09% | 7 | * | 8.0E-5s |
| Profile seoencoder_loadFromCache: | 0.00052s | 52.58% | 42 | * | 1.0E-5s |
| Profile executeMaintenanceTasks: | 0.0003s | 30.42% | 1 | * | 0.0003s |
| Profile _assignPriceInternal: | 0.00019s | 19.06% | 7 | * | 3.0E-5s |
| Profile _getLangTranslationArray: | 0.00016s | 16.57% | 65 | * | 0s |
| Profile getCategoryUri: | 0.00012s | 11.74% | 14 | * | 1.0E-5s |
| Profile smarty_function_oxmultilang: | 0.00012s | 11.6% | 48 | * | 0s |
| Profile fround: | 2.0E-5s | 2.02% | 53 | * | 0s |
| Profile _applyVAT: | 1.0E-5s | 0.91% | 14 | * | 0s |
| Profile articleAssignParentInternal: | 1.0E-5s | 0.82% | 7 | * | 0s |
| Profile isSearchEngine: | 1.0E-5s | 0.7% | 1 | * | 1.0E-5s |
| Profile generatePageNavigation: | 1.0E-5s | 0.6% | 2 | * | 0s |
| Profile oxviewconfig::setViewConfigParam: | 1.0E-5s | 0.58% | 33 | * | 0s |
| Profile oxviewconfig::getViewConfigParam: | 0s | 0.48% | 31 | * | 0s |
Marke
cl=oxwcategorytree(show/hide)
Memory usage: 3.557 MB (peak: 3.602 MB)
System memory usage: 2 MB (peak: 2 MB)
----------------------------------------------------------
System memory usage: 2 MB (peak: 2 MB)
Executed: 2024-06-09 14:25:28
Timestamp: 1717935928.0028
Execution time:0.0002----------------------------------------------------------
| Profile process: | 0.01357s | 5450.57% | 15 | * | 0.0009s |
| Profile oxNew: | 0.01204s | 4837.26% | 148 | * | 8.0E-5s |
| Profile oxAutoload: | 0.00485s | 1948.08% | 87 | * | 6.0E-5s |
| Profile buildTree: | 0.00173s | 695.79% | 1 | * | 0.00173s |
| Profile loadinglists: | 0.0014s | 562.45% | 1 | * | 0.0014s |
| Profile getArticleManufacturerUri: | 0.00137s | 549.52% | 7 | * | 0.0002s |
| Profile _getAmountPrice: | 0.00094s | 377.49% | 7 | * | 0.00013s |
| Profile parseThroughSmarty: | 0.00075s | 302.97% | 1 | * | 0.00075s |
| Profile articleAssign: | 0.00057s | 227.78% | 7 | * | 8.0E-5s |
| Profile seoencoder_loadFromCache: | 0.00052s | 210.63% | 43 | * | 1.0E-5s |
| Profile executeMaintenanceTasks: | 0.0003s | 121.36% | 1 | * | 0.0003s |
| Profile _assignPriceInternal: | 0.00019s | 76.05% | 7 | * | 3.0E-5s |
| Profile _getLangTranslationArray: | 0.00017s | 67.43% | 69 | * | 0s |
| Profile smarty_function_oxmultilang: | 0.00012s | 49.14% | 50 | * | 0s |
| Profile getCategoryUri: | 0.00012s | 46.84% | 14 | * | 1.0E-5s |
| Profile fround: | 2.0E-5s | 8.05% | 53 | * | 0s |
| Profile _applyVAT: | 1.0E-5s | 3.64% | 14 | * | 0s |
| Profile articleAssignParentInternal: | 1.0E-5s | 3.26% | 7 | * | 0s |
| Profile isSearchEngine: | 1.0E-5s | 2.78% | 1 | * | 1.0E-5s |
| Profile generatePageNavigation: | 1.0E-5s | 2.39% | 2 | * | 0s |
| Profile oxviewconfig::getViewConfigParam: | 1.0E-5s | 2.39% | 33 | * | 0s |
| Profile oxviewconfig::setViewConfigParam: | 1.0E-5s | 2.3% | 36 | * | 0s |
Tags
cl=oxwtagcloud(show/hide)
Memory usage: 3.695 MB (peak: 3.735 MB)
System memory usage: 2 MB (peak: 2 MB)
----------------------------------------------------------
System memory usage: 2 MB (peak: 2 MB)
Executed: 2024-06-09 14:25:28
Timestamp: 1717935928.0038
Execution time:0.001----------------------------------------------------------
| Profile process: | 0.01455s | 1467.05% | 16 | * | 0.00091s |
| Profile oxNew: | 0.01238s | 1247.92% | 156 | * | 8.0E-5s |
| Profile oxAutoload: | 0.00515s | 519.51% | 93 | * | 6.0E-5s |
| Profile buildTree: | 0.00173s | 174.57% | 1 | * | 0.00173s |
| Profile loadinglists: | 0.0014s | 141.12% | 1 | * | 0.0014s |
| Profile getArticleManufacturerUri: | 0.00137s | 137.88% | 7 | * | 0.0002s |
| Profile _getAmountPrice: | 0.00094s | 94.71% | 7 | * | 0.00013s |
| Profile parseThroughSmarty: | 0.00075s | 76.02% | 1 | * | 0.00075s |
| Profile articleAssign: | 0.00057s | 57.15% | 7 | * | 8.0E-5s |
| Profile seoencoder_loadFromCache: | 0.00053s | 52.94% | 44 | * | 1.0E-5s |
| Profile executeMaintenanceTasks: | 0.0003s | 30.45% | 1 | * | 0.0003s |
| Profile _assignPriceInternal: | 0.00019s | 19.08% | 7 | * | 3.0E-5s |
| Profile _getLangTranslationArray: | 0.00017s | 17.21% | 73 | * | 0s |
| Profile smarty_function_oxmultilang: | 0.00013s | 13.15% | 52 | * | 0s |
| Profile getCategoryUri: | 0.00012s | 11.75% | 14 | * | 1.0E-5s |
| Profile fround: | 2.0E-5s | 2.02% | 53 | * | 0s |
| Profile _applyVAT: | 1.0E-5s | 0.91% | 14 | * | 0s |
| Profile articleAssignParentInternal: | 1.0E-5s | 0.82% | 7 | * | 0s |
| Profile isSearchEngine: | 1.0E-5s | 0.7% | 1 | * | 1.0E-5s |
| Profile oxviewconfig::getViewConfigParam: | 1.0E-5s | 0.7% | 34 | * | 0s |
| Profile oxviewconfig::setViewConfigParam: | 1.0E-5s | 0.67% | 38 | * | 0s |
| Profile generatePageNavigation: | 1.0E-5s | 0.6% | 2 | * | 0s |
Liquid Force
-
Bindung LIQUID FORCE TRANSIT BOOT 2010
 259,00 € * In den Warenkorbcl=oxwarticlebox(show/hide)Memory usage: 2.811 MB (peak: 2.911 MB)
System memory usage: 2 MB (peak: 2 MB)Executed: 2024-06-09 14:25:27Timestamp: 1717935927.9893Execution time:0.0021
----------------------------------------------------------
Profile oxNew: 0.01116s 537.42% 79 * 0.00014s Profile oxAutoload: 0.00457s 220.14% 78 * 6.0E-5s Profile process: 0.00202s 97.26% 2 * 0.00101s Profile buildTree: 0.00173s 83.38% 1 * 0.00173s Profile loadinglists: 0.0014s 67.4% 1 * 0.0014s Profile articleAssign: 0.00057s 27.3% 7 * 8.0E-5s Profile getArticleManufacturerUri: 0.00038s 18.15% 1 * 0.00038s Profile _getAmountPrice: 0.00036s 17.38% 1 * 0.00036s Profile seoencoder_loadFromCache: 0.00033s 15.92% 15 * 2.0E-5s Profile executeMaintenanceTasks: 0.0003s 14.54% 1 * 0.0003s Profile _assignPriceInternal: 0.00017s 8.14% 1 * 0.00017s Profile _getLangTranslationArray: 0.00012s 5.96% 14 * 1.0E-5s Profile smarty_function_oxmultilang: 3.0E-5s 1.41% 10 * 0s Profile fround: 2.0E-5s 0.77% 16 * 0s Profile articleAssignParentInternal: 1.0E-5s 0.39% 7 * 0s Profile isSearchEngine: 1.0E-5s 0.33% 1 * 1.0E-5s Profile generatePageNavigation: 0s 0.2% 1 * 0s Profile _applyVAT: 0s 0.15% 2 * 0s Profile oxviewconfig::setViewConfigParam: 0s 0.05% 3 * 0s Profile oxviewconfig::getViewConfigParam: 0s 0.05% 5 * 0s -
Bindung LIQUID FORCE INDEX BOOT 2010
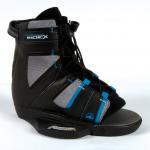 159,00 € * In den Warenkorbcl=oxwarticlebox(show/hide)Memory usage: 2.835 MB (peak: 2.979 MB)
System memory usage: 2 MB (peak: 2 MB)Executed: 2024-06-09 14:25:27Timestamp: 1717935927.9903Execution time:0.001
----------------------------------------------------------
Profile oxNew: 0.01118s 1171.66% 86 * 0.00013s Profile oxAutoload: 0.00457s 479.36% 78 * 6.0E-5s Profile process: 0.00297s 311.35% 3 * 0.00099s Profile buildTree: 0.00173s 181.55% 1 * 0.00173s Profile loadinglists: 0.0014s 146.76% 1 * 0.0014s Profile getArticleManufacturerUri: 0.0006s 62.46% 2 * 0.0003s Profile articleAssign: 0.00057s 59.44% 7 * 8.0E-5s Profile _getAmountPrice: 0.00051s 53.36% 2 * 0.00025s Profile seoencoder_loadFromCache: 0.00033s 34.77% 16 * 2.0E-5s Profile executeMaintenanceTasks: 0.0003s 31.67% 1 * 0.0003s Profile _assignPriceInternal: 0.00017s 18.15% 2 * 9.0E-5s Profile _getLangTranslationArray: 0.00013s 13.3% 17 * 1.0E-5s Profile smarty_function_oxmultilang: 3.0E-5s 3.6% 12 * 0s Profile fround: 2.0E-5s 1.67% 22 * 0s Profile articleAssignParentInternal: 1.0E-5s 0.85% 7 * 0s Profile isSearchEngine: 1.0E-5s 0.72% 1 * 1.0E-5s Profile _applyVAT: 0s 0.45% 4 * 0s Profile generatePageNavigation: 0s 0.42% 1 * 0s Profile oxviewconfig::setViewConfigParam: 0s 0.1% 5 * 0s Profile oxviewconfig::getViewConfigParam: 0s 0.1% 6 * 0s -
Wakeboard LIQUID FORCE SHANE 2010
 389,00 € * In den Warenkorbcl=oxwarticlebox(show/hide)Memory usage: 2.875 MB (peak: 3.019 MB)
System memory usage: 2 MB (peak: 2 MB)Executed: 2024-06-09 14:25:27Timestamp: 1717935927.9913Execution time:0.0009
----------------------------------------------------------
Profile oxNew: 0.01119s 1204.21% 93 * 0.00012s Profile oxAutoload: 0.00457s 492.15% 78 * 6.0E-5s Profile process: 0.0039s 419.22% 4 * 0.00097s Profile buildTree: 0.00173s 186.4% 1 * 0.00173s Profile loadinglists: 0.0014s 150.68% 1 * 0.0014s Profile getArticleManufacturerUri: 0.00083s 88.99% 3 * 0.00028s Profile _getAmountPrice: 0.00065s 69.85% 3 * 0.00022s Profile articleAssign: 0.00057s 61.02% 7 * 8.0E-5s Profile seoencoder_loadFromCache: 0.00033s 35.8% 17 * 2.0E-5s Profile executeMaintenanceTasks: 0.0003s 32.51% 1 * 0.0003s Profile _assignPriceInternal: 0.00018s 18.96% 3 * 6.0E-5s Profile _getLangTranslationArray: 0.00013s 13.86% 20 * 1.0E-5s Profile smarty_function_oxmultilang: 4.0E-5s 4.34% 14 * 0s Profile fround: 2.0E-5s 1.85% 28 * 0s Profile articleAssignParentInternal: 1.0E-5s 0.87% 7 * 0s Profile isSearchEngine: 1.0E-5s 0.74% 1 * 1.0E-5s Profile _applyVAT: 1.0E-5s 0.67% 6 * 0s Profile generatePageNavigation: 0s 0.44% 1 * 0s Profile oxviewconfig::setViewConfigParam: 0s 0.21% 7 * 0s Profile oxviewconfig::getViewConfigParam: 0s 0.1% 7 * 0s -
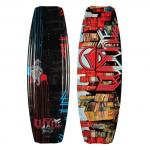
Wakeboard LIQUID FORCE GROOVE 2010
 cl=oxwarticlebox(show/hide)Memory usage: 2.914 MB (peak: 3.059 MB)
System memory usage: 2 MB (peak: 2 MB)Executed: 2024-06-09 14:25:27Timestamp: 1717935927.9921Execution time:0.0007
----------------------------------------------------------
Profile oxNew: 0.0112s 1571.04% 100 * 0.00011s Profile process: 0.00461s 645.99% 5 * 0.00092s Profile oxAutoload: 0.00457s 641.44% 78 * 6.0E-5s Profile buildTree: 0.00173s 242.94% 1 * 0.00173s Profile loadinglists: 0.0014s 196.39% 1 * 0.0014s Profile getArticleManufacturerUri: 0.00094s 131.97% 4 * 0.00024s Profile _getAmountPrice: 0.00071s 100.27% 4 * 0.00018s Profile articleAssign: 0.00057s 79.53% 7 * 8.0E-5s Profile seoencoder_loadFromCache: 0.00033s 46.79% 18 * 2.0E-5s Profile executeMaintenanceTasks: 0.0003s 42.37% 1 * 0.0003s Profile _assignPriceInternal: 0.00018s 25.15% 4 * 4.0E-5s Profile _getLangTranslationArray: 0.00013s 18.49% 24 * 1.0E-5s Profile smarty_function_oxmultilang: 5.0E-5s 6.79% 17 * 0s Profile fround: 2.0E-5s 2.54% 35 * 0s Profile articleAssignParentInternal: 1.0E-5s 1.14% 7 * 0s Profile isSearchEngine: 1.0E-5s 0.97% 1 * 1.0E-5s Profile _applyVAT: 1.0E-5s 0.87% 8 * 0s Profile generatePageNavigation: 0s 0.57% 1 * 0s Profile oxviewconfig::setViewConfigParam: 0s 0.27% 9 * 0s Profile oxviewconfig::getViewConfigParam: 0s 0.13% 8 * 0s -
Wakeboard LIQUID FORCE S4 2010
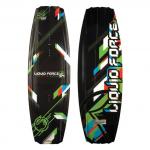 389,00 € * In den Warenkorbcl=oxwarticlebox(show/hide)Memory usage: 2.954 MB (peak: 3.099 MB)
System memory usage: 2 MB (peak: 2 MB)Executed: 2024-06-09 14:25:27Timestamp: 1717935927.9928Execution time:0.0007
----------------------------------------------------------
Profile oxNew: 0.01121s 1529.54% 107 * 0.0001s Profile process: 0.00534s 727.94% 6 * 0.00089s Profile oxAutoload: 0.00457s 623.91% 78 * 6.0E-5s Profile buildTree: 0.00173s 236.3% 1 * 0.00173s Profile loadinglists: 0.0014s 191.02% 1 * 0.0014s Profile getArticleManufacturerUri: 0.00108s 147.33% 5 * 0.00022s Profile _getAmountPrice: 0.00079s 107.48% 5 * 0.00016s Profile articleAssign: 0.00057s 77.36% 7 * 8.0E-5s Profile seoencoder_loadFromCache: 0.00033s 45.67% 19 * 2.0E-5s Profile executeMaintenanceTasks: 0.0003s 41.22% 1 * 0.0003s Profile _assignPriceInternal: 0.00018s 24.89% 5 * 4.0E-5s Profile _getLangTranslationArray: 0.00013s 18.25% 27 * 0s Profile smarty_function_oxmultilang: 5.0E-5s 7.42% 19 * 0s Profile fround: 2.0E-5s 2.47% 41 * 0s Profile articleAssignParentInternal: 1.0E-5s 1.11% 7 * 0s Profile isSearchEngine: 1.0E-5s 0.94% 1 * 1.0E-5s Profile _applyVAT: 1.0E-5s 0.85% 10 * 0s Profile generatePageNavigation: 0s 0.55% 1 * 0s Profile oxviewconfig::setViewConfigParam: 0s 0.26% 11 * 0s Profile oxviewconfig::getViewConfigParam: 0s 0.13% 9 * 0s -
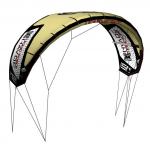
Kite LIQUID FORCE ENVY
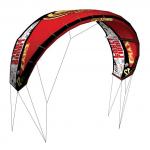 1.019,00 € * In den Warenkorbcl=oxwarticlebox(show/hide)Memory usage: 2.979 MB (peak: 3.122 MB)
System memory usage: 2 MB (peak: 2 MB)Executed: 2024-06-09 14:25:27Timestamp: 1717935927.9937Execution time:0.0008
----------------------------------------------------------
Profile oxNew: 0.01122s 1425.87% 114 * 0.0001s Profile process: 0.00612s 777.37% 7 * 0.00087s Profile oxAutoload: 0.00457s 581.01% 78 * 6.0E-5s Profile buildTree: 0.00173s 220.05% 1 * 0.00173s Profile loadinglists: 0.0014s 177.89% 1 * 0.0014s Profile getArticleManufacturerUri: 0.00121s 154.35% 6 * 0.0002s Profile _getAmountPrice: 0.00087s 110.75% 6 * 0.00015s Profile articleAssign: 0.00057s 72.04% 7 * 8.0E-5s Profile seoencoder_loadFromCache: 0.00034s 42.65% 20 * 2.0E-5s Profile executeMaintenanceTasks: 0.0003s 38.38% 1 * 0.0003s Profile _assignPriceInternal: 0.00019s 23.69% 6 * 3.0E-5s Profile _getLangTranslationArray: 0.00014s 17.36% 30 * 0s Profile smarty_function_oxmultilang: 6.0E-5s 7.39% 21 * 0s Profile fround: 2.0E-5s 2.42% 47 * 0s Profile articleAssignParentInternal: 1.0E-5s 1.03% 7 * 0s Profile _applyVAT: 1.0E-5s 0.91% 12 * 0s Profile isSearchEngine: 1.0E-5s 0.88% 1 * 1.0E-5s Profile generatePageNavigation: 0s 0.51% 1 * 0s Profile oxviewconfig::setViewConfigParam: 0s 0.24% 13 * 0s Profile oxviewconfig::getViewConfigParam: 0s 0.12% 10 * 0s -
Kite LIQUID FORCE HAVOC
 1.189,00 € * In den Warenkorbcl=oxwarticlebox(show/hide)Memory usage: 3.018 MB (peak: 3.162 MB)
System memory usage: 2 MB (peak: 2 MB)Executed: 2024-06-09 14:25:27Timestamp: 1717935927.9944Execution time:0.0007
----------------------------------------------------------
Profile oxNew: 0.01123s 1528.06% 121 * 9.0E-5s Profile process: 0.00685s 931.92% 8 * 0.00086s Profile oxAutoload: 0.00457s 622.09% 78 * 6.0E-5s Profile buildTree: 0.00173s 235.61% 1 * 0.00173s Profile loadinglists: 0.0014s 190.46% 1 * 0.0014s Profile getArticleManufacturerUri: 0.00137s 186.08% 7 * 0.0002s Profile _getAmountPrice: 0.00094s 127.83% 7 * 0.00013s Profile articleAssign: 0.00057s 77.13% 7 * 8.0E-5s Profile seoencoder_loadFromCache: 0.00034s 45.8% 21 * 2.0E-5s Profile executeMaintenanceTasks: 0.0003s 41.1% 1 * 0.0003s Profile _assignPriceInternal: 0.00019s 25.75% 7 * 3.0E-5s Profile _getLangTranslationArray: 0.00014s 18.85% 33 * 0s Profile smarty_function_oxmultilang: 6.0E-5s 8.6% 23 * 0s Profile fround: 2.0E-5s 2.72% 53 * 0s Profile _applyVAT: 1.0E-5s 1.23% 14 * 0s Profile articleAssignParentInternal: 1.0E-5s 1.1% 7 * 0s Profile isSearchEngine: 1.0E-5s 0.94% 1 * 1.0E-5s Profile generatePageNavigation: 0s 0.55% 1 * 0s Profile oxviewconfig::setViewConfigParam: 0s 0.26% 15 * 0s Profile oxviewconfig::getViewConfigParam: 0s 0.13% 11 * 0s
cl=oxwservicelist(show/hide)
Memory usage: 3.848 MB (peak: 3.866 MB)
System memory usage: 2 MB (peak: 2 MB)
----------------------------------------------------------
System memory usage: 2 MB (peak: 2 MB)
Executed: 2024-06-09 14:25:28
Timestamp: 1717935928.0054
Execution time:0.0007----------------------------------------------------------
| Profile process: | 0.01526s | 2143.09% | 17 | * | 0.0009s |
| Profile oxNew: | 0.01247s | 1750.69% | 161 | * | 8.0E-5s |
| Profile oxAutoload: | 0.00517s | 726.65% | 94 | * | 6.0E-5s |
| Profile buildTree: | 0.00173s | 243.19% | 1 | * | 0.00173s |
| Profile loadinglists: | 0.0014s | 196.59% | 1 | * | 0.0014s |
| Profile getArticleManufacturerUri: | 0.00137s | 192.07% | 7 | * | 0.0002s |
| Profile _getAmountPrice: | 0.00094s | 131.94% | 7 | * | 0.00013s |
| Profile parseThroughSmarty: | 0.00075s | 105.89% | 1 | * | 0.00075s |
| Profile articleAssign: | 0.00057s | 79.61% | 7 | * | 8.0E-5s |
| Profile seoencoder_loadFromCache: | 0.00053s | 74.62% | 50 | * | 1.0E-5s |
| Profile executeMaintenanceTasks: | 0.0003s | 42.42% | 1 | * | 0.0003s |
| Profile _assignPriceInternal: | 0.00019s | 26.58% | 7 | * | 3.0E-5s |
| Profile _getLangTranslationArray: | 0.00018s | 25.28% | 87 | * | 0s |
| Profile smarty_function_oxmultilang: | 0.00016s | 22.56% | 65 | * | 0s |
| Profile getCategoryUri: | 0.00012s | 16.37% | 14 | * | 1.0E-5s |
| Profile fround: | 2.0E-5s | 2.81% | 53 | * | 0s |
| Profile _applyVAT: | 1.0E-5s | 1.27% | 14 | * | 0s |
| Profile oxviewconfig::getViewConfigParam: | 1.0E-5s | 1.24% | 43 | * | 0s |
| Profile articleAssignParentInternal: | 1.0E-5s | 1.14% | 7 | * | 0s |
| Profile oxviewconfig::setViewConfigParam: | 1.0E-5s | 1.07% | 43 | * | 0s |
| Profile isSearchEngine: | 1.0E-5s | 0.97% | 1 | * | 1.0E-5s |
| Profile generatePageNavigation: | 1.0E-5s | 0.84% | 2 | * | 0s |
cl=oxwinformation(show/hide)
Memory usage: 3.948 MB (peak: 3.967 MB)
System memory usage: 2 MB (peak: 2 MB)
----------------------------------------------------------
System memory usage: 2 MB (peak: 2 MB)
Executed: 2024-06-09 14:25:28
Timestamp: 1717935928.0061
Execution time:0.0007----------------------------------------------------------
| Profile process: | 0.01594s | 2337.02% | 18 | * | 0.00089s |
| Profile oxNew: | 0.01256s | 1841.98% | 166 | * | 8.0E-5s |
| Profile oxAutoload: | 0.0052s | 761.87% | 95 | * | 5.0E-5s |
| Profile buildTree: | 0.00173s | 253.9% | 1 | * | 0.00173s |
| Profile loadinglists: | 0.0014s | 205.24% | 1 | * | 0.0014s |
| Profile getArticleManufacturerUri: | 0.00137s | 200.52% | 7 | * | 0.0002s |
| Profile _getAmountPrice: | 0.00094s | 137.75% | 7 | * | 0.00013s |
| Profile parseThroughSmarty: | 0.00075s | 110.56% | 1 | * | 0.00075s |
| Profile articleAssign: | 0.00057s | 83.12% | 7 | * | 8.0E-5s |
| Profile seoencoder_loadFromCache: | 0.00054s | 78.47% | 57 | * | 1.0E-5s |
| Profile executeMaintenanceTasks: | 0.0003s | 44.29% | 1 | * | 0.0003s |
| Profile _assignPriceInternal: | 0.00019s | 27.75% | 7 | * | 3.0E-5s |
| Profile _getLangTranslationArray: | 0.00018s | 26.95% | 90 | * | 0s |
| Profile smarty_function_oxmultilang: | 0.00017s | 24.26% | 67 | * | 0s |
| Profile getCategoryUri: | 0.00012s | 17.09% | 14 | * | 1.0E-5s |
| Profile fround: | 2.0E-5s | 2.94% | 53 | * | 0s |
| Profile _applyVAT: | 1.0E-5s | 1.33% | 14 | * | 0s |
| Profile oxviewconfig::getViewConfigParam: | 1.0E-5s | 1.29% | 44 | * | 0s |
| Profile articleAssignParentInternal: | 1.0E-5s | 1.19% | 7 | * | 0s |
| Profile oxviewconfig::setViewConfigParam: | 1.0E-5s | 1.12% | 45 | * | 0s |
| Profile isSearchEngine: | 1.0E-5s | 1.01% | 1 | * | 1.0E-5s |
| Profile generatePageNavigation: | 1.0E-5s | 0.87% | 2 | * | 0s |
cl=oxwmanufacturerlist(show/hide)
Memory usage: 4.005 MB (peak: 4.021 MB)
System memory usage: 2 MB (peak: 2 MB)
----------------------------------------------------------
System memory usage: 2 MB (peak: 2 MB)
Executed: 2024-06-09 14:25:28
Timestamp: 1717935928.0066
Execution time:0.0005----------------------------------------------------------
| Profile process: | 0.01639s | 3586.96% | 19 | * | 0.00086s |
| Profile oxNew: | 0.01265s | 2767.61% | 169 | * | 7.0E-5s |
| Profile oxAutoload: | 0.00522s | 1141.42% | 96 | * | 5.0E-5s |
| Profile buildTree: | 0.00173s | 378.93% | 1 | * | 0.00173s |
| Profile loadinglists: | 0.0014s | 306.31% | 1 | * | 0.0014s |
| Profile getArticleManufacturerUri: | 0.00137s | 299.27% | 7 | * | 0.0002s |
| Profile _getAmountPrice: | 0.00094s | 205.58% | 7 | * | 0.00013s |
| Profile parseThroughSmarty: | 0.00075s | 165% | 1 | * | 0.00075s |
| Profile articleAssign: | 0.00057s | 124.05% | 7 | * | 8.0E-5s |
| Profile seoencoder_loadFromCache: | 0.00054s | 118.68% | 67 | * | 1.0E-5s |
| Profile executeMaintenanceTasks: | 0.0003s | 66.09% | 1 | * | 0.0003s |
| Profile _assignPriceInternal: | 0.00019s | 41.42% | 7 | * | 3.0E-5s |
| Profile _getLangTranslationArray: | 0.00019s | 40.69% | 93 | * | 0s |
| Profile smarty_function_oxmultilang: | 0.00017s | 37.25% | 69 | * | 0s |
| Profile getCategoryUri: | 0.00012s | 25.51% | 14 | * | 1.0E-5s |
| Profile fround: | 2.0E-5s | 4.38% | 53 | * | 0s |
| Profile _applyVAT: | 1.0E-5s | 1.98% | 14 | * | 0s |
| Profile oxviewconfig::getViewConfigParam: | 1.0E-5s | 1.93% | 44 | * | 0s |
| Profile articleAssignParentInternal: | 1.0E-5s | 1.77% | 7 | * | 0s |
| Profile oxviewconfig::setViewConfigParam: | 1.0E-5s | 1.67% | 46 | * | 0s |
| Profile isSearchEngine: | 1.0E-5s | 1.51% | 1 | * | 1.0E-5s |
| Profile generatePageNavigation: | 1.0E-5s | 1.3% | 2 | * | 0s |
cl=oxwcategorytree(show/hide)
Memory usage: 4.032 MB (peak: 4.049 MB)
System memory usage: 2 MB (peak: 2 MB)
----------------------------------------------------------
System memory usage: 2 MB (peak: 2 MB)
Executed: 2024-06-09 14:25:28
Timestamp: 1717935928.0069
Execution time:0.0003----------------------------------------------------------
| Profile process: | 0.01667s | 5976.07% | 20 | * | 0.00083s |
| Profile oxNew: | 0.01265s | 4535.64% | 172 | * | 7.0E-5s |
| Profile oxAutoload: | 0.00522s | 1870.17% | 96 | * | 5.0E-5s |
| Profile buildTree: | 0.00173s | 620.85% | 1 | * | 0.00173s |
| Profile loadinglists: | 0.0014s | 501.88% | 1 | * | 0.0014s |
| Profile getArticleManufacturerUri: | 0.00137s | 490.34% | 7 | * | 0.0002s |
| Profile _getAmountPrice: | 0.00094s | 336.84% | 7 | * | 0.00013s |
| Profile parseThroughSmarty: | 0.00075s | 270.34% | 1 | * | 0.00075s |
| Profile articleAssign: | 0.00057s | 203.25% | 7 | * | 8.0E-5s |
| Profile seoencoder_loadFromCache: | 0.00054s | 194.44% | 67 | * | 1.0E-5s |
| Profile executeMaintenanceTasks: | 0.0003s | 108.29% | 1 | * | 0.0003s |
| Profile _assignPriceInternal: | 0.00019s | 67.86% | 7 | * | 3.0E-5s |
| Profile _getLangTranslationArray: | 0.00019s | 67.52% | 95 | * | 0s |
| Profile smarty_function_oxmultilang: | 0.00017s | 62.14% | 70 | * | 0s |
| Profile getCategoryUri: | 0.00012s | 41.79% | 14 | * | 1.0E-5s |
| Profile fround: | 2.0E-5s | 7.18% | 53 | * | 0s |
| Profile _applyVAT: | 1.0E-5s | 3.25% | 14 | * | 0s |
| Profile oxviewconfig::getViewConfigParam: | 1.0E-5s | 3.16% | 44 | * | 0s |
| Profile oxviewconfig::setViewConfigParam: | 1.0E-5s | 3.08% | 47 | * | 0s |
| Profile articleAssignParentInternal: | 1.0E-5s | 2.91% | 7 | * | 0s |
| Profile isSearchEngine: | 1.0E-5s | 2.48% | 1 | * | 1.0E-5s |
| Profile generatePageNavigation: | 1.0E-5s | 2.14% | 2 | * | 0s |
oxidresponsive.com - Responsive Templates & Designs für OXID Onlineshops. Weitere Informationen, Preise & Bestellen