ärmellos
träger
shirt
pima
lässig
longsleeve
locker
liquid force
langarm
kuyichi
kurz
kiteboarding
kiteboard
kite
jeans
gerade
dunkel
board
anna
2010
Mehr...
cl=oxwcookienote(show/hide)
Memory usage: 3.161 MB (peak: 3.196 MB)
System memory usage: 2 MB (peak: 2 MB)
Execution time:0.0004
----------------------------------------------------------
System memory usage: 2 MB (peak: 2 MB)
Execution time:0.0004
----------------------------------------------------------
| Profile oxNew: | 0.01039s | 2927.35% | 124 | * | 8.0E-5s |
| Profile process: | 0.00706s | 1989.38% | 9 | * | 0.00078s |
| Profile oxAutoload: | 0.00395s | 1113.91% | 79 | * | 5.0E-5s |
| Profile buildTree: | 0.00153s | 432.39% | 1 | * | 0.00153s |
| Profile loadinglists: | 0.00128s | 361.63% | 1 | * | 0.00128s |
| Profile getArticleManufacturerUri: | 0.00127s | 358.2% | 7 | * | 0.00018s |
| Profile _getAmountPrice: | 0.00105s | 295.7% | 7 | * | 0.00015s |
| Profile articleAssign: | 0.00056s | 156.92% | 7 | * | 8.0E-5s |
| Profile executeMaintenanceTasks: | 0.00032s | 90.79% | 1 | * | 0.00032s |
| Profile seoencoder_loadFromCache: | 0.00032s | 90.26% | 21 | * | 2.0E-5s |
| Profile _assignPriceInternal: | 0.00022s | 61.42% | 7 | * | 3.0E-5s |
| Profile _getLangTranslationArray: | 0.00017s | 47.38% | 34 | * | 0s |
| Profile smarty_function_oxmultilang: | 9.0E-5s | 25.74% | 23 | * | 0s |
| Profile fround: | 2.0E-5s | 5.58% | 53 | * | 0s |
| Profile _applyVAT: | 1.0E-5s | 2.89% | 14 | * | 0s |
| Profile isSearchEngine: | 1.0E-5s | 2.55% | 1 | * | 1.0E-5s |
| Profile articleAssignParentInternal: | 1.0E-5s | 2.15% | 7 | * | 0s |
| Profile generatePageNavigation: | 1.0E-5s | 1.68% | 2 | * | 0s |
| Profile oxviewconfig::setViewConfigParam: | 0s | 1.14% | 16 | * | 0s |
| Profile oxviewconfig::getViewConfigParam: | 0s | 0.87% | 11 | * | 0s |
cl=oxwlanguagelist(show/hide)
Memory usage: 3.199 MB (peak: 3.246 MB)
System memory usage: 2 MB (peak: 2 MB)
----------------------------------------------------------
System memory usage: 2 MB (peak: 2 MB)
Executed: 2024-05-29 14:22:04
Timestamp: 1716985324.5632
Execution time:0.0005----------------------------------------------------------
| Profile oxNew: | 0.01046s | 1958.84% | 127 | * | 8.0E-5s |
| Profile process: | 0.00759s | 1420.76% | 10 | * | 0.00076s |
| Profile oxAutoload: | 0.00397s | 743.88% | 80 | * | 5.0E-5s |
| Profile buildTree: | 0.00153s | 287.23% | 1 | * | 0.00153s |
| Profile loadinglists: | 0.00128s | 240.22% | 1 | * | 0.00128s |
| Profile getArticleManufacturerUri: | 0.00127s | 237.95% | 7 | * | 0.00018s |
| Profile _getAmountPrice: | 0.00105s | 196.43% | 7 | * | 0.00015s |
| Profile articleAssign: | 0.00056s | 104.24% | 7 | * | 8.0E-5s |
| Profile executeMaintenanceTasks: | 0.00032s | 60.31% | 1 | * | 0.00032s |
| Profile seoencoder_loadFromCache: | 0.00032s | 59.96% | 21 | * | 2.0E-5s |
| Profile _assignPriceInternal: | 0.00022s | 40.8% | 7 | * | 3.0E-5s |
| Profile _getLangTranslationArray: | 0.00017s | 31.88% | 35 | * | 0s |
| Profile smarty_function_oxmultilang: | 9.0E-5s | 17.1% | 23 | * | 0s |
| Profile fround: | 2.0E-5s | 3.71% | 53 | * | 0s |
| Profile _applyVAT: | 1.0E-5s | 1.92% | 14 | * | 0s |
| Profile isSearchEngine: | 1.0E-5s | 1.7% | 1 | * | 1.0E-5s |
| Profile articleAssignParentInternal: | 1.0E-5s | 1.43% | 7 | * | 0s |
| Profile generatePageNavigation: | 1.0E-5s | 1.12% | 2 | * | 0s |
| Profile oxviewconfig::setViewConfigParam: | 0s | 0.76% | 19 | * | 0s |
| Profile oxviewconfig::getViewConfigParam: | 0s | 0.58% | 13 | * | 0s |
cl=oxwcurrencylist(show/hide)
Memory usage: 3.25 MB (peak: 3.297 MB)
System memory usage: 2 MB (peak: 2 MB)
----------------------------------------------------------
System memory usage: 2 MB (peak: 2 MB)
Executed: 2024-05-29 14:22:04
Timestamp: 1716985324.5636
Execution time:0.0004----------------------------------------------------------
| Profile oxNew: | 0.01054s | 2526.53% | 130 | * | 8.0E-5s |
| Profile process: | 0.008s | 1918.7% | 11 | * | 0.00073s |
| Profile oxAutoload: | 0.00399s | 957.23% | 81 | * | 5.0E-5s |
| Profile buildTree: | 0.00153s | 367.87% | 1 | * | 0.00153s |
| Profile loadinglists: | 0.00128s | 307.66% | 1 | * | 0.00128s |
| Profile getArticleManufacturerUri: | 0.00127s | 304.75% | 7 | * | 0.00018s |
| Profile _getAmountPrice: | 0.00105s | 251.57% | 7 | * | 0.00015s |
| Profile articleAssign: | 0.00056s | 133.5% | 7 | * | 8.0E-5s |
| Profile executeMaintenanceTasks: | 0.00032s | 77.24% | 1 | * | 0.00032s |
| Profile seoencoder_loadFromCache: | 0.00032s | 76.79% | 21 | * | 2.0E-5s |
| Profile _assignPriceInternal: | 0.00022s | 52.26% | 7 | * | 3.0E-5s |
| Profile _getLangTranslationArray: | 0.00017s | 41.28% | 36 | * | 0s |
| Profile smarty_function_oxmultilang: | 9.0E-5s | 21.9% | 23 | * | 0s |
| Profile fround: | 2.0E-5s | 4.75% | 53 | * | 0s |
| Profile _applyVAT: | 1.0E-5s | 2.46% | 14 | * | 0s |
| Profile isSearchEngine: | 1.0E-5s | 2.17% | 1 | * | 1.0E-5s |
| Profile articleAssignParentInternal: | 1.0E-5s | 1.83% | 7 | * | 0s |
| Profile generatePageNavigation: | 1.0E-5s | 1.43% | 2 | * | 0s |
| Profile oxviewconfig::setViewConfigParam: | 0s | 0.97% | 21 | * | 0s |
| Profile oxviewconfig::getViewConfigParam: | 0s | 0.74% | 14 | * | 0s |
-
Anmelden
 Sie haben Ihr Passwort vergessen?
Kein Problem! Hier können Sie ein neues Passwort einrichten.
Sie erhalten eine E-Mail mit einem Link, um ein neues Passwort zu vergeben.
Sollten Sie innerhalb der nächsten Minuten KEINE E-Mail mit Ihren Zugangsdaten erhalten, so überprüfen Sie bitte: Haben Sie sich in unserem Shop bereits registriert? Wenn nicht, so tun Sie dies bitte einmalig im Rahmen des Bestellprozesses. Sie können dann selbst ein Passwort festlegen. Sobald Sie registriert sind, können Sie sich in Zukunft mit Ihrer E-Mail-Adresse und Ihrem Passwort einloggen.- Wenn Sie sich sicher sind, dass Sie sich in unserem Shop bereits registriert haben, dann überprüfen Sie bitte, ob Sie sich bei der Eingabe Ihrer E-Mail-Adresse evtl. vertippt haben.
Sollten Sie trotz korrekter E-Mail-Adresse und bereits bestehender Registrierung weiterhin Probleme mit dem Login haben und auch keine "Passwort vergessen"-E-Mail erhalten, so wenden Sie sich bitte per E-Mail an:
- Registrieren
cl=oxwservicemenu(show/hide)
Memory usage: 3.358 MB (peak: 3.432 MB)
System memory usage: 2 MB (peak: 2 MB)
Execution time:0.0022
----------------------------------------------------------
System memory usage: 2 MB (peak: 2 MB)
Execution time:0.0022
----------------------------------------------------------
| Profile oxNew: | 0.01073s | 495.66% | 136 | * | 8.0E-5s |
| Profile process: | 0.01016s | 469.57% | 12 | * | 0.00085s |
| Profile oxAutoload: | 0.00407s | 187.92% | 83 | * | 5.0E-5s |
| Profile buildTree: | 0.00153s | 70.89% | 1 | * | 0.00153s |
| Profile loadinglists: | 0.00128s | 59.29% | 1 | * | 0.00128s |
| Profile getArticleManufacturerUri: | 0.00127s | 58.73% | 7 | * | 0.00018s |
| Profile _getAmountPrice: | 0.00105s | 48.48% | 7 | * | 0.00015s |
| Profile articleAssign: | 0.00056s | 25.73% | 7 | * | 8.0E-5s |
| Profile seoencoder_loadFromCache: | 0.00038s | 17.52% | 26 | * | 1.0E-5s |
| Profile executeMaintenanceTasks: | 0.00032s | 14.89% | 1 | * | 0.00032s |
| Profile _assignPriceInternal: | 0.00022s | 10.07% | 7 | * | 3.0E-5s |
| Profile _getLangTranslationArray: | 0.00019s | 8.62% | 61 | * | 0s |
| Profile smarty_function_oxmultilang: | 0.00014s | 6.27% | 46 | * | 0s |
| Profile parseThroughSmarty: | 0.0001s | 4.43% | 1 | * | 0.0001s |
| Profile fround: | 2.0E-5s | 0.91% | 53 | * | 0s |
| Profile _applyVAT: | 1.0E-5s | 0.47% | 14 | * | 0s |
| Profile isSearchEngine: | 1.0E-5s | 0.42% | 1 | * | 1.0E-5s |
| Profile articleAssignParentInternal: | 1.0E-5s | 0.35% | 7 | * | 0s |
| Profile generatePageNavigation: | 1.0E-5s | 0.28% | 2 | * | 0s |
| Profile oxviewconfig::setViewConfigParam: | 1.0E-5s | 0.23% | 28 | * | 0s |
| Profile oxviewconfig::getViewConfigParam: | 0s | 0.19% | 27 | * | 0s |
cl=oxwcategorytree(show/hide)
Memory usage: 3.406 MB (peak: 3.519 MB)
System memory usage: 2 MB (peak: 2 MB)
----------------------------------------------------------
System memory usage: 2 MB (peak: 2 MB)
Executed: 2024-05-29 14:22:04
Timestamp: 1716985324.5671
Execution time:0.0012----------------------------------------------------------
| Profile process: | 0.01131s | 978.03% | 13 | * | 0.00087s |
| Profile oxNew: | 0.011s | 950.64% | 141 | * | 8.0E-5s |
| Profile oxAutoload: | 0.00418s | 361.21% | 86 | * | 5.0E-5s |
| Profile buildTree: | 0.00153s | 132.61% | 1 | * | 0.00153s |
| Profile loadinglists: | 0.00128s | 110.9% | 1 | * | 0.00128s |
| Profile getArticleManufacturerUri: | 0.00127s | 109.85% | 7 | * | 0.00018s |
| Profile _getAmountPrice: | 0.00105s | 90.68% | 7 | * | 0.00015s |
| Profile articleAssign: | 0.00056s | 48.12% | 7 | * | 8.0E-5s |
| Profile seoencoder_loadFromCache: | 0.0005s | 43.49% | 42 | * | 1.0E-5s |
| Profile executeMaintenanceTasks: | 0.00032s | 27.84% | 1 | * | 0.00032s |
| Profile _assignPriceInternal: | 0.00022s | 18.84% | 7 | * | 3.0E-5s |
| Profile _getLangTranslationArray: | 0.00019s | 16.36% | 64 | * | 0s |
| Profile smarty_function_oxmultilang: | 0.00014s | 12.39% | 48 | * | 0s |
| Profile getCategoryUri: | 0.00011s | 9.79% | 14 | * | 1.0E-5s |
| Profile parseThroughSmarty: | 0.0001s | 8.29% | 1 | * | 0.0001s |
| Profile fround: | 2.0E-5s | 1.71% | 53 | * | 0s |
| Profile _applyVAT: | 1.0E-5s | 0.89% | 14 | * | 0s |
| Profile isSearchEngine: | 1.0E-5s | 0.78% | 1 | * | 1.0E-5s |
| Profile articleAssignParentInternal: | 1.0E-5s | 0.66% | 7 | * | 0s |
| Profile generatePageNavigation: | 1.0E-5s | 0.52% | 2 | * | 0s |
| Profile oxviewconfig::setViewConfigParam: | 1.0E-5s | 0.43% | 32 | * | 0s |
| Profile oxviewconfig::getViewConfigParam: | 1.0E-5s | 0.43% | 31 | * | 0s |

cl=oxwminibasket(show/hide)
Memory usage: 3.445 MB (peak: 3.519 MB)
System memory usage: 2 MB (peak: 2 MB)
----------------------------------------------------------
System memory usage: 2 MB (peak: 2 MB)
Executed: 2024-05-29 14:22:04
Timestamp: 1716985324.5681
Execution time:0.0009----------------------------------------------------------
| Profile process: | 0.01224s | 1314.8% | 14 | * | 0.00087s |
| Profile oxNew: | 0.01108s | 1189.86% | 144 | * | 8.0E-5s |
| Profile oxAutoload: | 0.0042s | 450.83% | 87 | * | 5.0E-5s |
| Profile buildTree: | 0.00153s | 164.76% | 1 | * | 0.00153s |
| Profile loadinglists: | 0.00128s | 137.8% | 1 | * | 0.00128s |
| Profile getArticleManufacturerUri: | 0.00127s | 136.49% | 7 | * | 0.00018s |
| Profile _getAmountPrice: | 0.00105s | 112.68% | 7 | * | 0.00015s |
| Profile articleAssign: | 0.00056s | 59.8% | 7 | * | 8.0E-5s |
| Profile seoencoder_loadFromCache: | 0.0005s | 54.03% | 42 | * | 1.0E-5s |
| Profile executeMaintenanceTasks: | 0.00032s | 34.6% | 1 | * | 0.00032s |
| Profile _assignPriceInternal: | 0.00022s | 23.41% | 7 | * | 3.0E-5s |
| Profile _getLangTranslationArray: | 0.00019s | 20.44% | 65 | * | 0s |
| Profile smarty_function_oxmultilang: | 0.00014s | 15.39% | 48 | * | 0s |
| Profile getCategoryUri: | 0.00011s | 12.16% | 14 | * | 1.0E-5s |
| Profile parseThroughSmarty: | 0.0001s | 10.29% | 1 | * | 0.0001s |
| Profile fround: | 2.0E-5s | 2.13% | 53 | * | 0s |
| Profile _applyVAT: | 1.0E-5s | 1.1% | 14 | * | 0s |
| Profile isSearchEngine: | 1.0E-5s | 0.97% | 1 | * | 1.0E-5s |
| Profile articleAssignParentInternal: | 1.0E-5s | 0.82% | 7 | * | 0s |
| Profile generatePageNavigation: | 1.0E-5s | 0.64% | 2 | * | 0s |
| Profile oxviewconfig::setViewConfigParam: | 1.0E-5s | 0.54% | 33 | * | 0s |
| Profile oxviewconfig::getViewConfigParam: | 1.0E-5s | 0.54% | 31 | * | 0s |
Marke
cl=oxwcategorytree(show/hide)
Memory usage: 3.475 MB (peak: 3.519 MB)
System memory usage: 2 MB (peak: 2 MB)
----------------------------------------------------------
System memory usage: 2 MB (peak: 2 MB)
Executed: 2024-05-29 14:22:04
Timestamp: 1716985324.5689
Execution time:0.0002----------------------------------------------------------
| Profile process: | 0.01248s | 5132.35% | 15 | * | 0.00083s |
| Profile oxNew: | 0.01108s | 4556.86% | 147 | * | 8.0E-5s |
| Profile oxAutoload: | 0.0042s | 1725.98% | 87 | * | 5.0E-5s |
| Profile buildTree: | 0.00153s | 630.78% | 1 | * | 0.00153s |
| Profile loadinglists: | 0.00128s | 527.55% | 1 | * | 0.00128s |
| Profile getArticleManufacturerUri: | 0.00127s | 522.55% | 7 | * | 0.00018s |
| Profile _getAmountPrice: | 0.00105s | 431.37% | 7 | * | 0.00015s |
| Profile articleAssign: | 0.00056s | 228.92% | 7 | * | 8.0E-5s |
| Profile seoencoder_loadFromCache: | 0.0005s | 207.65% | 43 | * | 1.0E-5s |
| Profile executeMaintenanceTasks: | 0.00032s | 132.45% | 1 | * | 0.00032s |
| Profile _assignPriceInternal: | 0.00022s | 89.61% | 7 | * | 3.0E-5s |
| Profile _getLangTranslationArray: | 0.00019s | 79.41% | 69 | * | 0s |
| Profile smarty_function_oxmultilang: | 0.00015s | 61.76% | 50 | * | 0s |
| Profile getCategoryUri: | 0.00011s | 46.57% | 14 | * | 1.0E-5s |
| Profile parseThroughSmarty: | 0.0001s | 39.41% | 1 | * | 0.0001s |
| Profile fround: | 2.0E-5s | 8.14% | 53 | * | 0s |
| Profile _applyVAT: | 1.0E-5s | 4.22% | 14 | * | 0s |
| Profile isSearchEngine: | 1.0E-5s | 3.73% | 1 | * | 1.0E-5s |
| Profile articleAssignParentInternal: | 1.0E-5s | 3.14% | 7 | * | 0s |
| Profile generatePageNavigation: | 1.0E-5s | 2.45% | 2 | * | 0s |
| Profile oxviewconfig::getViewConfigParam: | 1.0E-5s | 2.45% | 33 | * | 0s |
| Profile oxviewconfig::setViewConfigParam: | 1.0E-5s | 2.06% | 36 | * | 0s |
Tags
cl=oxwtagcloud(show/hide)
Memory usage: 3.676 MB (peak: 3.716 MB)
System memory usage: 2 MB (peak: 2 MB)
----------------------------------------------------------
System memory usage: 2 MB (peak: 2 MB)
Executed: 2024-05-29 14:22:04
Timestamp: 1716985324.5699
Execution time:0.001----------------------------------------------------------
| Profile process: | 0.01346s | 1366.86% | 16 | * | 0.00084s |
| Profile oxNew: | 0.01142s | 1159.33% | 155 | * | 7.0E-5s |
| Profile oxAutoload: | 0.0045s | 456.96% | 93 | * | 5.0E-5s |
| Profile buildTree: | 0.00153s | 155.75% | 1 | * | 0.00153s |
| Profile loadinglists: | 0.00128s | 130.26% | 1 | * | 0.00128s |
| Profile getArticleManufacturerUri: | 0.00127s | 129.02% | 7 | * | 0.00018s |
| Profile _getAmountPrice: | 0.00105s | 106.51% | 7 | * | 0.00015s |
| Profile articleAssign: | 0.00056s | 56.52% | 7 | * | 8.0E-5s |
| Profile seoencoder_loadFromCache: | 0.00051s | 51.37% | 44 | * | 1.0E-5s |
| Profile executeMaintenanceTasks: | 0.00032s | 32.7% | 1 | * | 0.00032s |
| Profile _assignPriceInternal: | 0.00022s | 22.13% | 7 | * | 3.0E-5s |
| Profile _getLangTranslationArray: | 0.0002s | 19.92% | 73 | * | 0s |
| Profile smarty_function_oxmultilang: | 0.00016s | 16.07% | 52 | * | 0s |
| Profile getCategoryUri: | 0.00011s | 11.5% | 14 | * | 1.0E-5s |
| Profile parseThroughSmarty: | 0.0001s | 9.73% | 1 | * | 0.0001s |
| Profile fround: | 2.0E-5s | 2.01% | 53 | * | 0s |
| Profile _applyVAT: | 1.0E-5s | 1.04% | 14 | * | 0s |
| Profile isSearchEngine: | 1.0E-5s | 0.92% | 1 | * | 1.0E-5s |
| Profile articleAssignParentInternal: | 1.0E-5s | 0.77% | 7 | * | 0s |
| Profile generatePageNavigation: | 1.0E-5s | 0.61% | 2 | * | 0s |
| Profile oxviewconfig::getViewConfigParam: | 1.0E-5s | 0.61% | 34 | * | 0s |
| Profile oxviewconfig::setViewConfigParam: | 1.0E-5s | 0.51% | 38 | * | 0s |
Liquid Force
-
Bindung LIQUID FORCE INDEX BOOT 2010
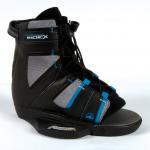 159,00 € * In den Warenkorbcl=oxwarticlebox(show/hide)Memory usage: 2.813 MB (peak: 2.873 MB)
System memory usage: 2 MB (peak: 2 MB)Executed: 2024-05-29 14:22:04Timestamp: 1716985324.5574Execution time:0.0029
----------------------------------------------------------
Profile oxNew: 0.01024s 347.71% 79 * 0.00013s Profile oxAutoload: 0.00393s 133.56% 78 * 5.0E-5s Profile process: 0.00288s 97.76% 2 * 0.00144s Profile buildTree: 0.00153s 52.11% 1 * 0.00153s Profile loadinglists: 0.00128s 43.58% 1 * 0.00128s Profile _getAmountPrice: 0.00057s 19.4% 1 * 0.00057s Profile articleAssign: 0.00056s 18.91% 7 * 8.0E-5s Profile getArticleManufacturerUri: 0.0004s 13.75% 1 * 0.0004s Profile executeMaintenanceTasks: 0.00032s 10.94% 1 * 0.00032s Profile seoencoder_loadFromCache: 0.00031s 10.68% 15 * 2.0E-5s Profile _assignPriceInternal: 0.0002s 6.76% 1 * 0.0002s Profile _getLangTranslationArray: 0.00015s 5.14% 14 * 1.0E-5s Profile smarty_function_oxmultilang: 6.0E-5s 1.95% 10 * 1.0E-5s Profile fround: 2.0E-5s 0.61% 16 * 0s Profile isSearchEngine: 1.0E-5s 0.31% 1 * 1.0E-5s Profile articleAssignParentInternal: 1.0E-5s 0.26% 7 * 0s Profile generatePageNavigation: 0s 0.14% 1 * 0s Profile _applyVAT: 0s 0.11% 2 * 0s Profile oxviewconfig::setViewConfigParam: 0s 0.07% 3 * 0s Profile oxviewconfig::getViewConfigParam: 0s 0.06% 5 * 0s -
Bindung LIQUID FORCE TRANSIT BOOT 2010
 259,00 € * In den Warenkorbcl=oxwarticlebox(show/hide)Memory usage: 2.837 MB (peak: 2.9 MB)
System memory usage: 2 MB (peak: 2 MB)Executed: 2024-05-29 14:22:04Timestamp: 1716985324.5581Execution time:0.0007
----------------------------------------------------------
Profile oxNew: 0.01025s 1447.24% 86 * 0.00012s Profile oxAutoload: 0.00393s 555.29% 78 * 5.0E-5s Profile process: 0.00358s 505.86% 3 * 0.00119s Profile buildTree: 0.00153s 216.63% 1 * 0.00153s Profile loadinglists: 0.00128s 181.18% 1 * 0.00128s Profile _getAmountPrice: 0.00067s 94.34% 2 * 0.00033s Profile getArticleManufacturerUri: 0.00058s 82.29% 2 * 0.00029s Profile articleAssign: 0.00056s 78.62% 7 * 8.0E-5s Profile executeMaintenanceTasks: 0.00032s 45.49% 1 * 0.00032s Profile seoencoder_loadFromCache: 0.00032s 44.55% 16 * 2.0E-5s Profile _assignPriceInternal: 0.0002s 28.52% 2 * 0.0001s Profile _getLangTranslationArray: 0.00015s 21.82% 17 * 1.0E-5s Profile smarty_function_oxmultilang: 6.0E-5s 8.96% 12 * 1.0E-5s Profile fround: 2.0E-5s 2.53% 22 * 0s Profile isSearchEngine: 1.0E-5s 1.28% 1 * 1.0E-5s Profile articleAssignParentInternal: 1.0E-5s 1.08% 7 * 0s Profile generatePageNavigation: 0s 0.57% 1 * 0s Profile _applyVAT: 0s 0.57% 4 * 0s Profile oxviewconfig::getViewConfigParam: 0s 0.44% 6 * 0s Profile oxviewconfig::setViewConfigParam: 0s 0.3% 5 * 0s -
Kite LIQUID FORCE ENVY
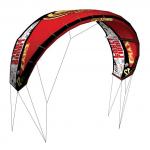 1.019,00 € * In den Warenkorbcl=oxwarticlebox(show/hide)Memory usage: 2.876 MB (peak: 2.94 MB)
System memory usage: 2 MB (peak: 2 MB)Executed: 2024-05-29 14:22:04Timestamp: 1716985324.5589Execution time:0.0008
----------------------------------------------------------
Profile oxNew: 0.01026s 1313.98% 93 * 0.00011s Profile process: 0.00436s 557.97% 4 * 0.00109s Profile oxAutoload: 0.00393s 503.42% 78 * 5.0E-5s Profile buildTree: 0.00153s 196.4% 1 * 0.00153s Profile loadinglists: 0.00128s 164.26% 1 * 0.00128s Profile _getAmountPrice: 0.00084s 107.94% 3 * 0.00028s Profile getArticleManufacturerUri: 0.00074s 94.6% 3 * 0.00025s Profile articleAssign: 0.00056s 71.28% 7 * 8.0E-5s Profile executeMaintenanceTasks: 0.00032s 41.24% 1 * 0.00032s Profile seoencoder_loadFromCache: 0.00032s 40.51% 17 * 2.0E-5s Profile _assignPriceInternal: 0.00021s 26.25% 3 * 7.0E-5s Profile _getLangTranslationArray: 0.00016s 20.18% 20 * 1.0E-5s Profile smarty_function_oxmultilang: 7.0E-5s 8.76% 14 * 0s Profile fround: 2.0E-5s 2.41% 28 * 0s Profile isSearchEngine: 1.0E-5s 1.16% 1 * 1.0E-5s Profile articleAssignParentInternal: 1.0E-5s 0.98% 7 * 0s Profile _applyVAT: 1.0E-5s 0.79% 6 * 0s Profile generatePageNavigation: 0s 0.52% 1 * 0s Profile oxviewconfig::getViewConfigParam: 0s 0.4% 7 * 0s Profile oxviewconfig::setViewConfigParam: 0s 0.27% 7 * 0s -
Kite LIQUID FORCE HAVOC
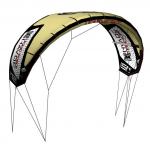 1.189,00 € * In den Warenkorbcl=oxwarticlebox(show/hide)Memory usage: 2.916 MB (peak: 2.979 MB)
System memory usage: 2 MB (peak: 2 MB)Executed: 2024-05-29 14:22:04Timestamp: 1716985324.5596Execution time:0.0007
----------------------------------------------------------
Profile oxNew: 0.01027s 1551.71% 100 * 0.0001s Profile process: 0.00502s 757.62% 5 * 0.001s Profile oxAutoload: 0.00393s 593.88% 78 * 5.0E-5s Profile buildTree: 0.00153s 231.69% 1 * 0.00153s Profile loadinglists: 0.00128s 193.77% 1 * 0.00128s Profile getArticleManufacturerUri: 0.00091s 138.03% 4 * 0.00023s Profile _getAmountPrice: 0.00091s 137.02% 4 * 0.00023s Profile articleAssign: 0.00056s 84.08% 7 * 8.0E-5s Profile executeMaintenanceTasks: 0.00032s 48.65% 1 * 0.00032s Profile seoencoder_loadFromCache: 0.00032s 47.79% 18 * 2.0E-5s Profile _assignPriceInternal: 0.00021s 31.4% 4 * 5.0E-5s Profile _getLangTranslationArray: 0.00016s 24.09% 23 * 1.0E-5s Profile smarty_function_oxmultilang: 7.0E-5s 11.09% 16 * 0s Profile fround: 2.0E-5s 2.99% 34 * 0s Profile isSearchEngine: 1.0E-5s 1.37% 1 * 1.0E-5s Profile _applyVAT: 1.0E-5s 1.26% 8 * 0s Profile articleAssignParentInternal: 1.0E-5s 1.15% 7 * 0s Profile generatePageNavigation: 0s 0.61% 1 * 0s Profile oxviewconfig::getViewConfigParam: 0s 0.47% 8 * 0s Profile oxviewconfig::setViewConfigParam: 0s 0.32% 9 * 0s -
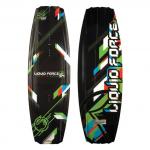
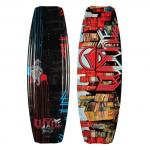
Wakeboard LIQUID FORCE GROOVE 2010
 cl=oxwarticlebox(show/hide)Memory usage: 2.956 MB (peak: 3.004 MB)
System memory usage: 2 MB (peak: 2 MB)Executed: 2024-05-29 14:22:04Timestamp: 1716985324.5603Execution time:0.0006
----------------------------------------------------------
Profile oxNew: 0.01028s 1794.01% 107 * 0.0001s Profile process: 0.00559s 974.63% 6 * 0.00093s Profile oxAutoload: 0.00393s 686.02% 78 * 5.0E-5s Profile buildTree: 0.00153s 267.64% 1 * 0.00153s Profile loadinglists: 0.00128s 223.84% 1 * 0.00128s Profile getArticleManufacturerUri: 0.00104s 182.11% 5 * 0.00021s Profile _getAmountPrice: 0.00096s 166.64% 5 * 0.00019s Profile articleAssign: 0.00056s 97.13% 7 * 8.0E-5s Profile executeMaintenanceTasks: 0.00032s 56.2% 1 * 0.00032s Profile seoencoder_loadFromCache: 0.00032s 55.37% 19 * 2.0E-5s Profile _assignPriceInternal: 0.00021s 36.77% 5 * 4.0E-5s Profile _getLangTranslationArray: 0.00016s 28.33% 27 * 1.0E-5s Profile smarty_function_oxmultilang: 8.0E-5s 14.23% 19 * 0s Profile fround: 2.0E-5s 3.45% 41 * 0s Profile isSearchEngine: 1.0E-5s 1.58% 1 * 1.0E-5s Profile _applyVAT: 1.0E-5s 1.46% 10 * 0s Profile articleAssignParentInternal: 1.0E-5s 1.33% 7 * 0s Profile generatePageNavigation: 0s 0.71% 1 * 0s Profile oxviewconfig::getViewConfigParam: 0s 0.54% 9 * 0s Profile oxviewconfig::setViewConfigParam: 0s 0.54% 11 * 0s -
Wakeboard LIQUID FORCE S4 2010
 389,00 € * In den Warenkorbcl=oxwarticlebox(show/hide)Memory usage: 2.979 MB (peak: 3.044 MB)
System memory usage: 2 MB (peak: 2 MB)Executed: 2024-05-29 14:22:04Timestamp: 1716985324.5608Execution time:0.0005
----------------------------------------------------------
Profile oxNew: 0.01029s 1882% 114 * 9.0E-5s Profile process: 0.00613s 1120.66% 7 * 0.00088s Profile oxAutoload: 0.00393s 718.92% 78 * 5.0E-5s Profile buildTree: 0.00153s 280.47% 1 * 0.00153s Profile loadinglists: 0.00128s 234.57% 1 * 0.00128s Profile getArticleManufacturerUri: 0.00117s 213.51% 6 * 0.00019s Profile _getAmountPrice: 0.001s 182.48% 6 * 0.00017s Profile articleAssign: 0.00056s 101.79% 7 * 8.0E-5s Profile executeMaintenanceTasks: 0.00032s 58.89% 1 * 0.00032s Profile seoencoder_loadFromCache: 0.00032s 58.2% 20 * 2.0E-5s Profile _assignPriceInternal: 0.00021s 39.1% 6 * 4.0E-5s Profile _getLangTranslationArray: 0.00016s 29.86% 30 * 1.0E-5s Profile smarty_function_oxmultilang: 9.0E-5s 15.82% 21 * 0s Profile fround: 2.0E-5s 3.62% 47 * 0s Profile _applyVAT: 1.0E-5s 1.7% 12 * 0s Profile isSearchEngine: 1.0E-5s 1.66% 1 * 1.0E-5s Profile articleAssignParentInternal: 1.0E-5s 1.39% 7 * 0s Profile generatePageNavigation: 0s 0.74% 1 * 0s Profile oxviewconfig::getViewConfigParam: 0s 0.57% 10 * 0s Profile oxviewconfig::setViewConfigParam: 0s 0.57% 13 * 0s -
Wakeboard LIQUID FORCE SHANE 2010
 389,00 € * In den Warenkorbcl=oxwarticlebox(show/hide)Memory usage: 3.02 MB (peak: 3.083 MB)
System memory usage: 2 MB (peak: 2 MB)Executed: 2024-05-29 14:22:04Timestamp: 1716985324.5615Execution time:0.0006
----------------------------------------------------------
Profile oxNew: 0.0103s 1766.97% 121 * 9.0E-5s Profile process: 0.00671s 1150% 8 * 0.00084s Profile oxAutoload: 0.00393s 674.24% 78 * 5.0E-5s Profile buildTree: 0.00153s 263.04% 1 * 0.00153s Profile loadinglists: 0.00128s 219.99% 1 * 0.00128s Profile getArticleManufacturerUri: 0.00127s 217.91% 7 * 0.00018s Profile _getAmountPrice: 0.00105s 179.89% 7 * 0.00015s Profile articleAssign: 0.00056s 95.46% 7 * 8.0E-5s Profile executeMaintenanceTasks: 0.00032s 55.23% 1 * 0.00032s Profile seoencoder_loadFromCache: 0.00032s 54.91% 21 * 2.0E-5s Profile _assignPriceInternal: 0.00022s 37.37% 7 * 3.0E-5s Profile _getLangTranslationArray: 0.00017s 28.5% 33 * 1.0E-5s Profile smarty_function_oxmultilang: 9.0E-5s 15.66% 23 * 0s Profile fround: 2.0E-5s 3.39% 53 * 0s Profile _applyVAT: 1.0E-5s 1.76% 14 * 0s Profile isSearchEngine: 1.0E-5s 1.55% 1 * 1.0E-5s Profile articleAssignParentInternal: 1.0E-5s 1.31% 7 * 0s Profile generatePageNavigation: 0s 0.7% 1 * 0s Profile oxviewconfig::getViewConfigParam: 0s 0.53% 11 * 0s Profile oxviewconfig::setViewConfigParam: 0s 0.53% 15 * 0s
cl=oxwservicelist(show/hide)
Memory usage: 3.823 MB (peak: 3.857 MB)
System memory usage: 2 MB (peak: 2 MB)
----------------------------------------------------------
System memory usage: 2 MB (peak: 2 MB)
Executed: 2024-05-29 14:22:04
Timestamp: 1716985324.5713
Execution time:0.0007----------------------------------------------------------
| Profile process: | 0.01411s | 2169.97% | 17 | * | 0.00083s |
| Profile oxNew: | 0.0115s | 1769.12% | 160 | * | 7.0E-5s |
| Profile oxAutoload: | 0.00452s | 695.31% | 94 | * | 5.0E-5s |
| Profile buildTree: | 0.00153s | 235.94% | 1 | * | 0.00153s |
| Profile loadinglists: | 0.00128s | 197.32% | 1 | * | 0.00128s |
| Profile getArticleManufacturerUri: | 0.00127s | 195.45% | 7 | * | 0.00018s |
| Profile _getAmountPrice: | 0.00105s | 161.35% | 7 | * | 0.00015s |
| Profile articleAssign: | 0.00056s | 85.63% | 7 | * | 8.0E-5s |
| Profile seoencoder_loadFromCache: | 0.00051s | 78.4% | 50 | * | 1.0E-5s |
| Profile executeMaintenanceTasks: | 0.00032s | 49.54% | 1 | * | 0.00032s |
| Profile _assignPriceInternal: | 0.00022s | 33.52% | 7 | * | 3.0E-5s |
| Profile _getLangTranslationArray: | 0.00021s | 31.57% | 87 | * | 0s |
| Profile smarty_function_oxmultilang: | 0.00018s | 28.16% | 65 | * | 0s |
| Profile getCategoryUri: | 0.00011s | 17.42% | 14 | * | 1.0E-5s |
| Profile parseThroughSmarty: | 0.0001s | 14.74% | 1 | * | 0.0001s |
| Profile fround: | 2.0E-5s | 3.04% | 53 | * | 0s |
| Profile _applyVAT: | 1.0E-5s | 1.58% | 14 | * | 0s |
| Profile isSearchEngine: | 1.0E-5s | 1.39% | 1 | * | 1.0E-5s |
| Profile articleAssignParentInternal: | 1.0E-5s | 1.17% | 7 | * | 0s |
| Profile oxviewconfig::getViewConfigParam: | 1.0E-5s | 1.06% | 43 | * | 0s |
| Profile generatePageNavigation: | 1.0E-5s | 0.92% | 2 | * | 0s |
| Profile oxviewconfig::setViewConfigParam: | 1.0E-5s | 0.92% | 43 | * | 0s |
cl=oxwinformation(show/hide)
Memory usage: 3.923 MB (peak: 3.942 MB)
System memory usage: 2 MB (peak: 2 MB)
----------------------------------------------------------
System memory usage: 2 MB (peak: 2 MB)
Executed: 2024-05-29 14:22:04
Timestamp: 1716985324.572
Execution time:0.0007----------------------------------------------------------
| Profile process: | 0.01479s | 2165.61% | 18 | * | 0.00082s |
| Profile oxNew: | 0.01159s | 1697.66% | 165 | * | 7.0E-5s |
| Profile oxAutoload: | 0.00454s | 664.98% | 95 | * | 5.0E-5s |
| Profile buildTree: | 0.00153s | 224.65% | 1 | * | 0.00153s |
| Profile loadinglists: | 0.00128s | 187.88% | 1 | * | 0.00128s |
| Profile getArticleManufacturerUri: | 0.00127s | 186.1% | 7 | * | 0.00018s |
| Profile _getAmountPrice: | 0.00105s | 153.63% | 7 | * | 0.00015s |
| Profile articleAssign: | 0.00056s | 81.53% | 7 | * | 8.0E-5s |
| Profile seoencoder_loadFromCache: | 0.00052s | 75.49% | 57 | * | 1.0E-5s |
| Profile executeMaintenanceTasks: | 0.00032s | 47.17% | 1 | * | 0.00032s |
| Profile _assignPriceInternal: | 0.00022s | 31.91% | 7 | * | 3.0E-5s |
| Profile _getLangTranslationArray: | 0.00021s | 30.52% | 90 | * | 0s |
| Profile smarty_function_oxmultilang: | 0.00019s | 27.69% | 67 | * | 0s |
| Profile getCategoryUri: | 0.00011s | 16.59% | 14 | * | 1.0E-5s |
| Profile parseThroughSmarty: | 0.0001s | 14.04% | 1 | * | 0.0001s |
| Profile fround: | 2.0E-5s | 2.9% | 53 | * | 0s |
| Profile _applyVAT: | 1.0E-5s | 1.5% | 14 | * | 0s |
| Profile isSearchEngine: | 1.0E-5s | 1.33% | 1 | * | 1.0E-5s |
| Profile articleAssignParentInternal: | 1.0E-5s | 1.12% | 7 | * | 0s |
| Profile oxviewconfig::getViewConfigParam: | 1.0E-5s | 1.01% | 44 | * | 0s |
| Profile generatePageNavigation: | 1.0E-5s | 0.87% | 2 | * | 0s |
| Profile oxviewconfig::setViewConfigParam: | 1.0E-5s | 0.87% | 45 | * | 0s |
cl=oxwmanufacturerlist(show/hide)
Memory usage: 3.979 MB (peak: 3.996 MB)
System memory usage: 2 MB (peak: 2 MB)
----------------------------------------------------------
System memory usage: 2 MB (peak: 2 MB)
Executed: 2024-05-29 14:22:04
Timestamp: 1716985324.5725
Execution time:0.0004----------------------------------------------------------
| Profile process: | 0.01522s | 3492.29% | 19 | * | 0.0008s |
| Profile oxNew: | 0.01167s | 2678.56% | 168 | * | 7.0E-5s |
| Profile oxAutoload: | 0.00456s | 1046.66% | 96 | * | 5.0E-5s |
| Profile buildTree: | 0.00153s | 351.97% | 1 | * | 0.00153s |
| Profile loadinglists: | 0.00128s | 294.37% | 1 | * | 0.00128s |
| Profile getArticleManufacturerUri: | 0.00127s | 291.58% | 7 | * | 0.00018s |
| Profile _getAmountPrice: | 0.00105s | 240.7% | 7 | * | 0.00015s |
| Profile articleAssign: | 0.00056s | 127.74% | 7 | * | 8.0E-5s |
| Profile seoencoder_loadFromCache: | 0.00052s | 119.37% | 67 | * | 1.0E-5s |
| Profile executeMaintenanceTasks: | 0.00032s | 73.91% | 1 | * | 0.00032s |
| Profile _assignPriceInternal: | 0.00022s | 50% | 7 | * | 3.0E-5s |
| Profile _getLangTranslationArray: | 0.00021s | 48.25% | 93 | * | 0s |
| Profile smarty_function_oxmultilang: | 0.00019s | 44.58% | 69 | * | 0s |
| Profile getCategoryUri: | 0.00011s | 25.98% | 14 | * | 1.0E-5s |
| Profile parseThroughSmarty: | 0.0001s | 21.99% | 1 | * | 0.0001s |
| Profile fround: | 2.0E-5s | 4.54% | 53 | * | 0s |
| Profile _applyVAT: | 1.0E-5s | 2.35% | 14 | * | 0s |
| Profile isSearchEngine: | 1.0E-5s | 2.08% | 1 | * | 1.0E-5s |
| Profile articleAssignParentInternal: | 1.0E-5s | 1.75% | 7 | * | 0s |
| Profile oxviewconfig::getViewConfigParam: | 1.0E-5s | 1.59% | 44 | * | 0s |
| Profile generatePageNavigation: | 1.0E-5s | 1.37% | 2 | * | 0s |
| Profile oxviewconfig::setViewConfigParam: | 1.0E-5s | 1.37% | 46 | * | 0s |
cl=oxwcategorytree(show/hide)
Memory usage: 4.007 MB (peak: 4.022 MB)
System memory usage: 2 MB (peak: 2 MB)
----------------------------------------------------------
System memory usage: 2 MB (peak: 2 MB)
Executed: 2024-05-29 14:22:04
Timestamp: 1716985324.5728
Execution time:0.0003----------------------------------------------------------
| Profile process: | 0.01549s | 5693.87% | 20 | * | 0.00077s |
| Profile oxNew: | 0.01168s | 4292.81% | 171 | * | 7.0E-5s |
| Profile oxAutoload: | 0.00456s | 1676.86% | 96 | * | 5.0E-5s |
| Profile buildTree: | 0.00153s | 563.89% | 1 | * | 0.00153s |
| Profile loadinglists: | 0.00128s | 471.6% | 1 | * | 0.00128s |
| Profile getArticleManufacturerUri: | 0.00127s | 467.13% | 7 | * | 0.00018s |
| Profile _getAmountPrice: | 0.00105s | 385.63% | 7 | * | 0.00015s |
| Profile articleAssign: | 0.00056s | 204.65% | 7 | * | 8.0E-5s |
| Profile seoencoder_loadFromCache: | 0.00052s | 191.24% | 67 | * | 1.0E-5s |
| Profile executeMaintenanceTasks: | 0.00032s | 118.4% | 1 | * | 0.00032s |
| Profile _assignPriceInternal: | 0.00022s | 80.11% | 7 | * | 3.0E-5s |
| Profile _getLangTranslationArray: | 0.00021s | 77.65% | 95 | * | 0s |
| Profile smarty_function_oxmultilang: | 0.0002s | 72.57% | 70 | * | 0s |
| Profile getCategoryUri: | 0.00011s | 41.63% | 14 | * | 1.0E-5s |
| Profile parseThroughSmarty: | 0.0001s | 35.23% | 1 | * | 0.0001s |
| Profile fround: | 2.0E-5s | 7.27% | 53 | * | 0s |
| Profile _applyVAT: | 1.0E-5s | 3.77% | 14 | * | 0s |
| Profile isSearchEngine: | 1.0E-5s | 3.33% | 1 | * | 1.0E-5s |
| Profile articleAssignParentInternal: | 1.0E-5s | 2.8% | 7 | * | 0s |
| Profile oxviewconfig::getViewConfigParam: | 1.0E-5s | 2.54% | 44 | * | 0s |
| Profile generatePageNavigation: | 1.0E-5s | 2.19% | 2 | * | 0s |
| Profile oxviewconfig::setViewConfigParam: | 1.0E-5s | 2.19% | 47 | * | 0s |
oxidresponsive.com - Responsive Templates & Designs für OXID Onlineshops. Weitere Informationen, Preise & Bestellen