ärmellos
träger
shirt
pima
lässig
longsleeve
locker
liquid force
langarm
kuyichi
kurz
kiteboarding
kiteboard
kite
jeans
gerade
dunkel
board
anna
2010
Mehr...
cl=oxwcookienote(show/hide)
Memory usage: 3.161 MB (peak: 3.196 MB)
System memory usage: 2 MB (peak: 2 MB)
Execution time:0.0004
----------------------------------------------------------
System memory usage: 2 MB (peak: 2 MB)
Execution time:0.0004
----------------------------------------------------------
| Profile process: | 0.00689s | 1964.06% | 9 | * | 0.00077s |
| Profile oxNew: | 0.00552s | 1572.62% | 124 | * | 4.0E-5s |
| Profile oxAutoload: | 0.00222s | 631.39% | 79 | * | 3.0E-5s |
| Profile getArticleManufacturerUri: | 0.00124s | 352.45% | 7 | * | 0.00018s |
| Profile buildTree: | 0.00097s | 276.7% | 1 | * | 0.00097s |
| Profile _getAmountPrice: | 0.00088s | 250.68% | 7 | * | 0.00013s |
| Profile loadinglists: | 0.00085s | 242.19% | 1 | * | 0.00085s |
| Profile articleAssign: | 0.00028s | 80.64% | 7 | * | 4.0E-5s |
| Profile _assignPriceInternal: | 0.00023s | 64.13% | 7 | * | 3.0E-5s |
| Profile seoencoder_loadFromCache: | 0.00019s | 54.35% | 21 | * | 1.0E-5s |
| Profile executeMaintenanceTasks: | 0.00014s | 39.61% | 1 | * | 0.00014s |
| Profile _getLangTranslationArray: | 9.0E-5s | 24.32% | 34 | * | 0s |
| Profile smarty_function_oxmultilang: | 7.0E-5s | 20.45% | 23 | * | 0s |
| Profile fround: | 2.0E-5s | 4.28% | 53 | * | 0s |
| Profile _applyVAT: | 1.0E-5s | 3.13% | 14 | * | 0s |
| Profile articleAssignParentInternal: | 1.0E-5s | 1.63% | 7 | * | 0s |
| Profile isSearchEngine: | 1.0E-5s | 1.43% | 1 | * | 1.0E-5s |
| Profile generatePageNavigation: | 1.0E-5s | 1.43% | 2 | * | 0s |
| Profile oxviewconfig::setViewConfigParam: | 0s | 1.15% | 16 | * | 0s |
| Profile oxviewconfig::getViewConfigParam: | 0s | 1.09% | 11 | * | 0s |
cl=oxwlanguagelist(show/hide)
Memory usage: 3.199 MB (peak: 3.246 MB)
System memory usage: 2 MB (peak: 2 MB)
----------------------------------------------------------
System memory usage: 2 MB (peak: 2 MB)
Executed: 2024-06-09 08:10:40
Timestamp: 1717913440.3657
Execution time:0.0005----------------------------------------------------------
| Profile process: | 0.00743s | 1371.23% | 10 | * | 0.00074s |
| Profile oxNew: | 0.00559s | 1032.07% | 127 | * | 4.0E-5s |
| Profile oxAutoload: | 0.00224s | 412.54% | 80 | * | 3.0E-5s |
| Profile getArticleManufacturerUri: | 0.00124s | 228.24% | 7 | * | 0.00018s |
| Profile buildTree: | 0.00097s | 179.19% | 1 | * | 0.00097s |
| Profile _getAmountPrice: | 0.00088s | 162.34% | 7 | * | 0.00013s |
| Profile loadinglists: | 0.00085s | 156.84% | 1 | * | 0.00085s |
| Profile articleAssign: | 0.00028s | 52.22% | 7 | * | 4.0E-5s |
| Profile _assignPriceInternal: | 0.00023s | 41.53% | 7 | * | 3.0E-5s |
| Profile seoencoder_loadFromCache: | 0.00019s | 35.2% | 21 | * | 1.0E-5s |
| Profile executeMaintenanceTasks: | 0.00014s | 25.65% | 1 | * | 0.00014s |
| Profile _getLangTranslationArray: | 9.0E-5s | 15.93% | 35 | * | 0s |
| Profile smarty_function_oxmultilang: | 7.0E-5s | 13.24% | 23 | * | 0s |
| Profile fround: | 2.0E-5s | 2.77% | 53 | * | 0s |
| Profile _applyVAT: | 1.0E-5s | 2.02% | 14 | * | 0s |
| Profile articleAssignParentInternal: | 1.0E-5s | 1.06% | 7 | * | 0s |
| Profile isSearchEngine: | 1.0E-5s | 0.92% | 1 | * | 1.0E-5s |
| Profile generatePageNavigation: | 1.0E-5s | 0.92% | 2 | * | 0s |
| Profile oxviewconfig::getViewConfigParam: | 0s | 0.88% | 13 | * | 0s |
| Profile oxviewconfig::setViewConfigParam: | 0s | 0.75% | 19 | * | 0s |
cl=oxwcurrencylist(show/hide)
Memory usage: 3.249 MB (peak: 3.297 MB)
System memory usage: 2 MB (peak: 2 MB)
----------------------------------------------------------
System memory usage: 2 MB (peak: 2 MB)
Executed: 2024-06-09 08:10:40
Timestamp: 1717913440.3662
Execution time:0.0004----------------------------------------------------------
| Profile process: | 0.00784s | 1911.34% | 11 | * | 0.00071s |
| Profile oxNew: | 0.00567s | 1382.27% | 130 | * | 4.0E-5s |
| Profile oxAutoload: | 0.00226s | 550.06% | 81 | * | 3.0E-5s |
| Profile getArticleManufacturerUri: | 0.00124s | 301.63% | 7 | * | 0.00018s |
| Profile buildTree: | 0.00097s | 236.8% | 1 | * | 0.00097s |
| Profile _getAmountPrice: | 0.00088s | 214.53% | 7 | * | 0.00013s |
| Profile loadinglists: | 0.00085s | 207.27% | 1 | * | 0.00085s |
| Profile articleAssign: | 0.00028s | 69.01% | 7 | * | 4.0E-5s |
| Profile _assignPriceInternal: | 0.00023s | 54.88% | 7 | * | 3.0E-5s |
| Profile seoencoder_loadFromCache: | 0.00019s | 46.51% | 21 | * | 1.0E-5s |
| Profile executeMaintenanceTasks: | 0.00014s | 33.9% | 1 | * | 0.00014s |
| Profile _getLangTranslationArray: | 9.0E-5s | 21.28% | 36 | * | 0s |
| Profile smarty_function_oxmultilang: | 7.0E-5s | 17.5% | 23 | * | 0s |
| Profile fround: | 2.0E-5s | 3.66% | 53 | * | 0s |
| Profile _applyVAT: | 1.0E-5s | 2.67% | 14 | * | 0s |
| Profile articleAssignParentInternal: | 1.0E-5s | 1.4% | 7 | * | 0s |
| Profile oxviewconfig::setViewConfigParam: | 1.0E-5s | 1.28% | 21 | * | 0s |
| Profile isSearchEngine: | 1.0E-5s | 1.22% | 1 | * | 1.0E-5s |
| Profile generatePageNavigation: | 1.0E-5s | 1.22% | 2 | * | 0s |
| Profile oxviewconfig::getViewConfigParam: | 0s | 1.16% | 14 | * | 0s |
-
Anmelden
 Sie haben Ihr Passwort vergessen?
Kein Problem! Hier können Sie ein neues Passwort einrichten.
Sie erhalten eine E-Mail mit einem Link, um ein neues Passwort zu vergeben.
Sollten Sie innerhalb der nächsten Minuten KEINE E-Mail mit Ihren Zugangsdaten erhalten, so überprüfen Sie bitte: Haben Sie sich in unserem Shop bereits registriert? Wenn nicht, so tun Sie dies bitte einmalig im Rahmen des Bestellprozesses. Sie können dann selbst ein Passwort festlegen. Sobald Sie registriert sind, können Sie sich in Zukunft mit Ihrer E-Mail-Adresse und Ihrem Passwort einloggen.- Wenn Sie sich sicher sind, dass Sie sich in unserem Shop bereits registriert haben, dann überprüfen Sie bitte, ob Sie sich bei der Eingabe Ihrer E-Mail-Adresse evtl. vertippt haben.
Sollten Sie trotz korrekter E-Mail-Adresse und bereits bestehender Registrierung weiterhin Probleme mit dem Login haben und auch keine "Passwort vergessen"-E-Mail erhalten, so wenden Sie sich bitte per E-Mail an:
- Registrieren
cl=oxwservicemenu(show/hide)
Memory usage: 3.439 MB (peak: 3.602 MB)
System memory usage: 2 MB (peak: 2 MB)
Execution time:0.0028
----------------------------------------------------------
System memory usage: 2 MB (peak: 2 MB)
Execution time:0.0028
----------------------------------------------------------
| Profile process: | 0.01058s | 384.65% | 12 | * | 0.00088s |
| Profile oxNew: | 0.00586s | 213.03% | 137 | * | 4.0E-5s |
| Profile oxAutoload: | 0.00233s | 84.72% | 83 | * | 3.0E-5s |
| Profile getArticleManufacturerUri: | 0.00124s | 44.95% | 7 | * | 0.00018s |
| Profile buildTree: | 0.00097s | 35.29% | 1 | * | 0.00097s |
| Profile _getAmountPrice: | 0.00088s | 31.97% | 7 | * | 0.00013s |
| Profile loadinglists: | 0.00085s | 30.89% | 1 | * | 0.00085s |
| Profile parseThroughSmarty: | 0.0007s | 25.51% | 1 | * | 0.0007s |
| Profile articleAssign: | 0.00028s | 10.28% | 7 | * | 4.0E-5s |
| Profile seoencoder_loadFromCache: | 0.00025s | 9.07% | 26 | * | 1.0E-5s |
| Profile _assignPriceInternal: | 0.00023s | 8.18% | 7 | * | 3.0E-5s |
| Profile executeMaintenanceTasks: | 0.00014s | 5.05% | 1 | * | 0.00014s |
| Profile smarty_function_oxmultilang: | 0.00012s | 4.41% | 46 | * | 0s |
| Profile _getLangTranslationArray: | 0.0001s | 3.79% | 61 | * | 0s |
| Profile fround: | 2.0E-5s | 0.55% | 53 | * | 0s |
| Profile _applyVAT: | 1.0E-5s | 0.4% | 14 | * | 0s |
| Profile oxviewconfig::setViewConfigParam: | 1.0E-5s | 0.26% | 28 | * | 0s |
| Profile articleAssignParentInternal: | 1.0E-5s | 0.21% | 7 | * | 0s |
| Profile isSearchEngine: | 1.0E-5s | 0.18% | 1 | * | 1.0E-5s |
| Profile generatePageNavigation: | 1.0E-5s | 0.18% | 2 | * | 0s |
| Profile oxviewconfig::getViewConfigParam: | 0s | 0.17% | 27 | * | 0s |
cl=oxwcategorytree(show/hide)
Memory usage: 3.488 MB (peak: 3.602 MB)
System memory usage: 2 MB (peak: 2 MB)
----------------------------------------------------------
System memory usage: 2 MB (peak: 2 MB)
Executed: 2024-06-09 08:10:40
Timestamp: 1717913440.3702
Execution time:0.0012----------------------------------------------------------
| Profile process: | 0.01176s | 998.83% | 13 | * | 0.0009s |
| Profile oxNew: | 0.00613s | 521.21% | 142 | * | 4.0E-5s |
| Profile oxAutoload: | 0.00244s | 207.47% | 86 | * | 3.0E-5s |
| Profile getArticleManufacturerUri: | 0.00124s | 105.08% | 7 | * | 0.00018s |
| Profile buildTree: | 0.00097s | 82.5% | 1 | * | 0.00097s |
| Profile _getAmountPrice: | 0.00088s | 74.74% | 7 | * | 0.00013s |
| Profile loadinglists: | 0.00085s | 72.21% | 1 | * | 0.00085s |
| Profile parseThroughSmarty: | 0.0007s | 59.63% | 1 | * | 0.0007s |
| Profile seoencoder_loadFromCache: | 0.00037s | 31.64% | 42 | * | 1.0E-5s |
| Profile articleAssign: | 0.00028s | 24.04% | 7 | * | 4.0E-5s |
| Profile _assignPriceInternal: | 0.00023s | 19.12% | 7 | * | 3.0E-5s |
| Profile executeMaintenanceTasks: | 0.00014s | 11.81% | 1 | * | 0.00014s |
| Profile smarty_function_oxmultilang: | 0.00013s | 10.88% | 48 | * | 0s |
| Profile getCategoryUri: | 0.00011s | 9.24% | 14 | * | 1.0E-5s |
| Profile _getLangTranslationArray: | 0.00011s | 9.2% | 64 | * | 0s |
| Profile fround: | 2.0E-5s | 1.28% | 53 | * | 0s |
| Profile _applyVAT: | 1.0E-5s | 0.93% | 14 | * | 0s |
| Profile oxviewconfig::setViewConfigParam: | 1.0E-5s | 0.71% | 32 | * | 0s |
| Profile articleAssignParentInternal: | 1.0E-5s | 0.49% | 7 | * | 0s |
| Profile oxviewconfig::getViewConfigParam: | 1.0E-5s | 0.49% | 31 | * | 0s |
| Profile isSearchEngine: | 1.0E-5s | 0.43% | 1 | * | 1.0E-5s |
| Profile generatePageNavigation: | 1.0E-5s | 0.43% | 2 | * | 0s |

cl=oxwminibasket(show/hide)
Memory usage: 3.527 MB (peak: 3.602 MB)
System memory usage: 2 MB (peak: 2 MB)
----------------------------------------------------------
System memory usage: 2 MB (peak: 2 MB)
Executed: 2024-06-09 08:10:40
Timestamp: 1717913440.3712
Execution time:0.0009----------------------------------------------------------
| Profile process: | 0.01267s | 1380.06% | 14 | * | 0.00091s |
| Profile oxNew: | 0.00621s | 676.68% | 145 | * | 4.0E-5s |
| Profile oxAutoload: | 0.00246s | 268.16% | 87 | * | 3.0E-5s |
| Profile getArticleManufacturerUri: | 0.00124s | 134.72% | 7 | * | 0.00018s |
| Profile buildTree: | 0.00097s | 105.76% | 1 | * | 0.00097s |
| Profile _getAmountPrice: | 0.00088s | 95.82% | 7 | * | 0.00013s |
| Profile loadinglists: | 0.00085s | 92.57% | 1 | * | 0.00085s |
| Profile parseThroughSmarty: | 0.0007s | 76.45% | 1 | * | 0.0007s |
| Profile seoencoder_loadFromCache: | 0.00037s | 40.56% | 42 | * | 1.0E-5s |
| Profile articleAssign: | 0.00028s | 30.82% | 7 | * | 4.0E-5s |
| Profile _assignPriceInternal: | 0.00023s | 24.51% | 7 | * | 3.0E-5s |
| Profile executeMaintenanceTasks: | 0.00014s | 15.14% | 1 | * | 0.00014s |
| Profile smarty_function_oxmultilang: | 0.00013s | 13.94% | 48 | * | 0s |
| Profile _getLangTranslationArray: | 0.00011s | 11.89% | 65 | * | 0s |
| Profile getCategoryUri: | 0.00011s | 11.84% | 14 | * | 1.0E-5s |
| Profile fround: | 2.0E-5s | 1.64% | 53 | * | 0s |
| Profile _applyVAT: | 1.0E-5s | 1.19% | 14 | * | 0s |
| Profile oxviewconfig::setViewConfigParam: | 1.0E-5s | 1.04% | 33 | * | 0s |
| Profile articleAssignParentInternal: | 1.0E-5s | 0.62% | 7 | * | 0s |
| Profile oxviewconfig::getViewConfigParam: | 1.0E-5s | 0.62% | 31 | * | 0s |
| Profile isSearchEngine: | 1.0E-5s | 0.55% | 1 | * | 1.0E-5s |
| Profile generatePageNavigation: | 1.0E-5s | 0.55% | 2 | * | 0s |
Marke
cl=oxwcategorytree(show/hide)
Memory usage: 3.556 MB (peak: 3.602 MB)
System memory usage: 2 MB (peak: 2 MB)
----------------------------------------------------------
System memory usage: 2 MB (peak: 2 MB)
Executed: 2024-06-09 08:10:40
Timestamp: 1717913440.372
Execution time:0.0002----------------------------------------------------------
| Profile process: | 0.01291s | 5268.58% | 15 | * | 0.00086s |
| Profile oxNew: | 0.00622s | 2536.58% | 148 | * | 4.0E-5s |
| Profile oxAutoload: | 0.00246s | 1004.57% | 87 | * | 3.0E-5s |
| Profile getArticleManufacturerUri: | 0.00124s | 504.67% | 7 | * | 0.00018s |
| Profile buildTree: | 0.00097s | 396.21% | 1 | * | 0.00097s |
| Profile _getAmountPrice: | 0.00088s | 358.95% | 7 | * | 0.00013s |
| Profile loadinglists: | 0.00085s | 346.79% | 1 | * | 0.00085s |
| Profile parseThroughSmarty: | 0.0007s | 286.38% | 1 | * | 0.0007s |
| Profile seoencoder_loadFromCache: | 0.00037s | 152.82% | 43 | * | 1.0E-5s |
| Profile articleAssign: | 0.00028s | 115.47% | 7 | * | 4.0E-5s |
| Profile _assignPriceInternal: | 0.00023s | 91.83% | 7 | * | 3.0E-5s |
| Profile executeMaintenanceTasks: | 0.00014s | 56.71% | 1 | * | 0.00014s |
| Profile smarty_function_oxmultilang: | 0.00014s | 55.54% | 50 | * | 0s |
| Profile _getLangTranslationArray: | 0.00011s | 45.82% | 69 | * | 0s |
| Profile getCategoryUri: | 0.00011s | 44.36% | 14 | * | 1.0E-5s |
| Profile fround: | 2.0E-5s | 6.13% | 53 | * | 0s |
| Profile _applyVAT: | 1.0E-5s | 4.47% | 14 | * | 0s |
| Profile oxviewconfig::setViewConfigParam: | 1.0E-5s | 3.89% | 36 | * | 0s |
| Profile oxviewconfig::getViewConfigParam: | 1.0E-5s | 2.72% | 33 | * | 0s |
| Profile articleAssignParentInternal: | 1.0E-5s | 2.33% | 7 | * | 0s |
| Profile isSearchEngine: | 1.0E-5s | 2.04% | 1 | * | 1.0E-5s |
| Profile generatePageNavigation: | 1.0E-5s | 2.04% | 2 | * | 0s |
Tags
cl=oxwtagcloud(show/hide)
Memory usage: 3.694 MB (peak: 3.734 MB)
System memory usage: 2 MB (peak: 2 MB)
----------------------------------------------------------
System memory usage: 2 MB (peak: 2 MB)
Executed: 2024-06-09 08:10:40
Timestamp: 1717913440.373
Execution time:0.001----------------------------------------------------------
| Profile process: | 0.01388s | 1433.5% | 16 | * | 0.00087s |
| Profile oxNew: | 0.00655s | 676.82% | 156 | * | 4.0E-5s |
| Profile oxAutoload: | 0.00276s | 284.85% | 93 | * | 3.0E-5s |
| Profile getArticleManufacturerUri: | 0.00124s | 127.78% | 7 | * | 0.00018s |
| Profile buildTree: | 0.00097s | 100.32% | 1 | * | 0.00097s |
| Profile _getAmountPrice: | 0.00088s | 90.89% | 7 | * | 0.00013s |
| Profile loadinglists: | 0.00085s | 87.81% | 1 | * | 0.00085s |
| Profile parseThroughSmarty: | 0.0007s | 72.51% | 1 | * | 0.0007s |
| Profile seoencoder_loadFromCache: | 0.00038s | 38.89% | 44 | * | 1.0E-5s |
| Profile articleAssign: | 0.00028s | 29.24% | 7 | * | 4.0E-5s |
| Profile _assignPriceInternal: | 0.00023s | 23.25% | 7 | * | 3.0E-5s |
| Profile smarty_function_oxmultilang: | 0.00014s | 14.88% | 52 | * | 0s |
| Profile executeMaintenanceTasks: | 0.00014s | 14.36% | 1 | * | 0.00014s |
| Profile _getLangTranslationArray: | 0.00012s | 11.9% | 73 | * | 0s |
| Profile getCategoryUri: | 0.00011s | 11.23% | 14 | * | 1.0E-5s |
| Profile fround: | 2.0E-5s | 1.55% | 53 | * | 0s |
| Profile _applyVAT: | 1.0E-5s | 1.13% | 14 | * | 0s |
| Profile oxviewconfig::setViewConfigParam: | 1.0E-5s | 0.99% | 38 | * | 0s |
| Profile oxviewconfig::getViewConfigParam: | 1.0E-5s | 0.69% | 34 | * | 0s |
| Profile articleAssignParentInternal: | 1.0E-5s | 0.59% | 7 | * | 0s |
| Profile isSearchEngine: | 1.0E-5s | 0.52% | 1 | * | 1.0E-5s |
| Profile generatePageNavigation: | 1.0E-5s | 0.52% | 2 | * | 0s |
Liquid Force
-
Bindung LIQUID FORCE TRANSIT BOOT 2010
 259,00 € * In den Warenkorbcl=oxwarticlebox(show/hide)Memory usage: 2.812 MB (peak: 2.912 MB)
System memory usage: 2 MB (peak: 2 MB)Executed: 2024-06-09 08:10:40Timestamp: 1717913440.3592Execution time:0.0021
----------------------------------------------------------
Profile oxNew: 0.00537s 259.97% 79 * 7.0E-5s Profile oxAutoload: 0.0022s 106.34% 78 * 3.0E-5s Profile process: 0.00201s 97.15% 2 * 0.001s Profile buildTree: 0.00097s 47.03% 1 * 0.00097s Profile loadinglists: 0.00085s 41.16% 1 * 0.00085s Profile _getAmountPrice: 0.00038s 18.4% 1 * 0.00038s Profile getArticleManufacturerUri: 0.00028s 13.75% 1 * 0.00028s Profile articleAssign: 0.00028s 13.71% 7 * 4.0E-5s Profile _assignPriceInternal: 0.00021s 9.93% 1 * 0.00021s Profile seoencoder_loadFromCache: 0.00019s 9.01% 15 * 1.0E-5s Profile executeMaintenanceTasks: 0.00014s 6.73% 1 * 0.00014s Profile _getLangTranslationArray: 6.0E-5s 3.14% 14 * 0s Profile smarty_function_oxmultilang: 3.0E-5s 1.64% 10 * 0s Profile fround: 1.0E-5s 0.58% 16 * 0s Profile articleAssignParentInternal: 1.0E-5s 0.28% 7 * 0s Profile isSearchEngine: 1.0E-5s 0.24% 1 * 1.0E-5s Profile generatePageNavigation: 0s 0.15% 1 * 0s Profile _applyVAT: 0s 0.1% 2 * 0s Profile oxviewconfig::getViewConfigParam: 0s 0.09% 5 * 0s Profile oxviewconfig::setViewConfigParam: 0s 0.05% 3 * 0s -
Bindung LIQUID FORCE INDEX BOOT 2010
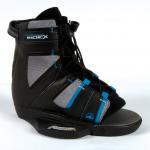 159,00 € * In den Warenkorbcl=oxwarticlebox(show/hide)Memory usage: 2.837 MB (peak: 2.98 MB)
System memory usage: 2 MB (peak: 2 MB)Executed: 2024-06-09 08:10:40Timestamp: 1717913440.3601Execution time:0.0008
----------------------------------------------------------
Profile oxNew: 0.00538s 636.25% 86 * 6.0E-5s Profile process: 0.00285s 336.67% 3 * 0.00095s Profile oxAutoload: 0.0022s 259.58% 78 * 3.0E-5s Profile buildTree: 0.00097s 114.8% 1 * 0.00097s Profile loadinglists: 0.00085s 100.48% 1 * 0.00085s Profile _getAmountPrice: 0.00048s 57.22% 2 * 0.00024s Profile getArticleManufacturerUri: 0.00048s 56.26% 2 * 0.00024s Profile articleAssign: 0.00028s 33.46% 7 * 4.0E-5s Profile _assignPriceInternal: 0.00021s 24.69% 2 * 0.0001s Profile seoencoder_loadFromCache: 0.00019s 22.1% 16 * 1.0E-5s Profile executeMaintenanceTasks: 0.00014s 16.43% 1 * 0.00014s Profile _getLangTranslationArray: 7.0E-5s 7.89% 17 * 0s Profile smarty_function_oxmultilang: 4.0E-5s 4.82% 12 * 0s Profile fround: 1.0E-5s 1.41% 22 * 0s Profile articleAssignParentInternal: 1.0E-5s 0.68% 7 * 0s Profile isSearchEngine: 1.0E-5s 0.59% 1 * 1.0E-5s Profile generatePageNavigation: 0s 0.37% 1 * 0s Profile _applyVAT: 0s 0.37% 4 * 0s Profile oxviewconfig::getViewConfigParam: 0s 0.34% 6 * 0s Profile oxviewconfig::setViewConfigParam: 0s 0.11% 5 * 0s -
Wakeboard LIQUID FORCE SHANE 2010
 389,00 € * In den Warenkorbcl=oxwarticlebox(show/hide)Memory usage: 2.876 MB (peak: 3.021 MB)
System memory usage: 2 MB (peak: 2 MB)Executed: 2024-06-09 08:10:40Timestamp: 1717913440.3609Execution time:0.0008
----------------------------------------------------------
Profile oxNew: 0.0054s 685.67% 93 * 6.0E-5s Profile process: 0.00363s 461.22% 4 * 0.00091s Profile oxAutoload: 0.0022s 279.01% 78 * 3.0E-5s Profile buildTree: 0.00097s 123.39% 1 * 0.00097s Profile loadinglists: 0.00085s 108% 1 * 0.00085s Profile getArticleManufacturerUri: 0.00064s 81.43% 3 * 0.00021s Profile _getAmountPrice: 0.00059s 74.58% 3 * 0.0002s Profile articleAssign: 0.00028s 35.96% 7 * 4.0E-5s Profile _assignPriceInternal: 0.00021s 27.05% 3 * 7.0E-5s Profile seoencoder_loadFromCache: 0.00019s 23.87% 17 * 1.0E-5s Profile executeMaintenanceTasks: 0.00014s 17.66% 1 * 0.00014s Profile _getLangTranslationArray: 7.0E-5s 8.85% 20 * 0s Profile smarty_function_oxmultilang: 5.0E-5s 5.94% 14 * 0s Profile fround: 1.0E-5s 1.64% 28 * 0s Profile articleAssignParentInternal: 1.0E-5s 0.73% 7 * 0s Profile _applyVAT: 1.0E-5s 0.67% 6 * 0s Profile isSearchEngine: 1.0E-5s 0.64% 1 * 1.0E-5s Profile oxviewconfig::getViewConfigParam: 0s 0.48% 7 * 0s Profile generatePageNavigation: 0s 0.39% 1 * 0s Profile oxviewconfig::setViewConfigParam: 0s 0.24% 7 * 0s -
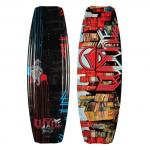
Wakeboard LIQUID FORCE GROOVE 2010
 cl=oxwarticlebox(show/hide)Memory usage: 2.916 MB (peak: 3.06 MB)
System memory usage: 2 MB (peak: 2 MB)Executed: 2024-06-09 08:10:40Timestamp: 1717913440.3617Execution time:0.0008
----------------------------------------------------------
Profile oxNew: 0.00541s 685.96% 100 * 5.0E-5s Profile process: 0.00441s 560.18% 5 * 0.00088s Profile oxAutoload: 0.0022s 278.67% 78 * 3.0E-5s Profile buildTree: 0.00097s 123.24% 1 * 0.00097s Profile loadinglists: 0.00085s 107.87% 1 * 0.00085s Profile getArticleManufacturerUri: 0.00081s 102.27% 4 * 0.0002s Profile _getAmountPrice: 0.0007s 89.2% 4 * 0.00018s Profile articleAssign: 0.00028s 35.92% 7 * 4.0E-5s Profile _assignPriceInternal: 0.00022s 27.38% 4 * 5.0E-5s Profile seoencoder_loadFromCache: 0.00019s 23.84% 18 * 1.0E-5s Profile executeMaintenanceTasks: 0.00014s 17.64% 1 * 0.00014s Profile _getLangTranslationArray: 7.0E-5s 9.47% 24 * 0s Profile smarty_function_oxmultilang: 6.0E-5s 7.08% 17 * 0s Profile fround: 1.0E-5s 1.79% 35 * 0s Profile _applyVAT: 1.0E-5s 0.91% 8 * 0s Profile articleAssignParentInternal: 1.0E-5s 0.73% 7 * 0s Profile isSearchEngine: 1.0E-5s 0.64% 1 * 1.0E-5s Profile oxviewconfig::getViewConfigParam: 0s 0.48% 8 * 0s Profile generatePageNavigation: 0s 0.39% 1 * 0s Profile oxviewconfig::setViewConfigParam: 0s 0.24% 9 * 0s -
Wakeboard LIQUID FORCE S4 2010
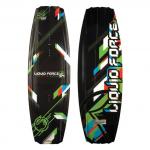 389,00 € * In den Warenkorbcl=oxwarticlebox(show/hide)Memory usage: 2.955 MB (peak: 3.084 MB)
System memory usage: 2 MB (peak: 2 MB)Executed: 2024-06-09 08:10:40Timestamp: 1717913440.3625Execution time:0.0007
----------------------------------------------------------
Profile oxNew: 0.00542s 741.87% 107 * 5.0E-5s Profile process: 0.00514s 704.08% 6 * 0.00086s Profile oxAutoload: 0.0022s 300.78% 78 * 3.0E-5s Profile buildTree: 0.00097s 133.02% 1 * 0.00097s Profile getArticleManufacturerUri: 0.00095s 130.11% 5 * 0.00019s Profile loadinglists: 0.00085s 116.43% 1 * 0.00085s Profile _getAmountPrice: 0.00077s 106.01% 5 * 0.00015s Profile articleAssign: 0.00028s 38.77% 7 * 4.0E-5s Profile _assignPriceInternal: 0.00022s 29.98% 5 * 4.0E-5s Profile seoencoder_loadFromCache: 0.00019s 25.87% 19 * 1.0E-5s Profile executeMaintenanceTasks: 0.00014s 19.04% 1 * 0.00014s Profile _getLangTranslationArray: 8.0E-5s 10.61% 27 * 0s Profile smarty_function_oxmultilang: 6.0E-5s 8.3% 19 * 0s Profile fround: 2.0E-5s 2.06% 41 * 0s Profile _applyVAT: 1.0E-5s 1.11% 10 * 0s Profile articleAssignParentInternal: 1.0E-5s 0.78% 7 * 0s Profile isSearchEngine: 1.0E-5s 0.69% 1 * 1.0E-5s Profile oxviewconfig::getViewConfigParam: 0s 0.52% 9 * 0s Profile generatePageNavigation: 0s 0.42% 1 * 0s Profile oxviewconfig::setViewConfigParam: 0s 0.39% 11 * 0s -
Kite LIQUID FORCE ENVY
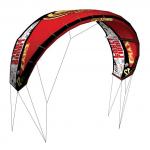 1.019,00 € * In den Warenkorbcl=oxwarticlebox(show/hide)Memory usage: 2.979 MB (peak: 3.123 MB)
System memory usage: 2 MB (peak: 2 MB)Executed: 2024-06-09 08:10:40Timestamp: 1717913440.3632Execution time:0.0007
----------------------------------------------------------
Profile process: 0.00584s 830.48% 7 * 0.00083s Profile oxNew: 0.00543s 771.92% 114 * 5.0E-5s Profile oxAutoload: 0.0022s 312.31% 78 * 3.0E-5s Profile getArticleManufacturerUri: 0.00109s 155.17% 6 * 0.00018s Profile buildTree: 0.00097s 138.11% 1 * 0.00097s Profile loadinglists: 0.00085s 120.89% 1 * 0.00085s Profile _getAmountPrice: 0.00083s 117.87% 6 * 0.00014s Profile articleAssign: 0.00028s 40.25% 7 * 4.0E-5s Profile _assignPriceInternal: 0.00022s 31.57% 6 * 4.0E-5s Profile seoencoder_loadFromCache: 0.00019s 26.99% 20 * 1.0E-5s Profile executeMaintenanceTasks: 0.00014s 19.77% 1 * 0.00014s Profile _getLangTranslationArray: 8.0E-5s 11.6% 30 * 0s Profile smarty_function_oxmultilang: 7.0E-5s 9.49% 21 * 0s Profile fround: 2.0E-5s 2.14% 47 * 0s Profile _applyVAT: 1.0E-5s 1.42% 12 * 0s Profile articleAssignParentInternal: 1.0E-5s 0.81% 7 * 0s Profile isSearchEngine: 1.0E-5s 0.71% 1 * 1.0E-5s Profile oxviewconfig::getViewConfigParam: 0s 0.54% 10 * 0s Profile generatePageNavigation: 0s 0.44% 1 * 0s Profile oxviewconfig::setViewConfigParam: 0s 0.41% 13 * 0s -
Kite LIQUID FORCE HAVOC
 1.189,00 € * In den Warenkorbcl=oxwarticlebox(show/hide)Memory usage: 3.019 MB (peak: 3.163 MB)
System memory usage: 2 MB (peak: 2 MB)Executed: 2024-06-09 08:10:40Timestamp: 1717913440.364Execution time:0.0007
----------------------------------------------------------
Profile process: 0.00655s 923.07% 8 * 0.00082s Profile oxNew: 0.00544s 766.98% 121 * 4.0E-5s Profile oxAutoload: 0.0022s 309.68% 78 * 3.0E-5s Profile getArticleManufacturerUri: 0.00124s 174.45% 7 * 0.00018s Profile buildTree: 0.00097s 136.95% 1 * 0.00097s Profile _getAmountPrice: 0.00088s 124.08% 7 * 0.00013s Profile loadinglists: 0.00085s 119.87% 1 * 0.00085s Profile articleAssign: 0.00028s 39.91% 7 * 4.0E-5s Profile _assignPriceInternal: 0.00023s 31.74% 7 * 3.0E-5s Profile seoencoder_loadFromCache: 0.00019s 26.9% 21 * 1.0E-5s Profile executeMaintenanceTasks: 0.00014s 19.6% 1 * 0.00014s Profile _getLangTranslationArray: 8.0E-5s 11.77% 33 * 0s Profile smarty_function_oxmultilang: 7.0E-5s 10.12% 23 * 0s Profile fround: 2.0E-5s 2.12% 53 * 0s Profile _applyVAT: 1.0E-5s 1.55% 14 * 0s Profile articleAssignParentInternal: 1.0E-5s 0.81% 7 * 0s Profile isSearchEngine: 1.0E-5s 0.71% 1 * 1.0E-5s Profile oxviewconfig::setViewConfigParam: 0s 0.57% 15 * 0s Profile oxviewconfig::getViewConfigParam: 0s 0.54% 11 * 0s Profile generatePageNavigation: 0s 0.44% 1 * 0s
cl=oxwservicelist(show/hide)
Memory usage: 3.843 MB (peak: 3.877 MB)
System memory usage: 4 MB (peak: 4 MB)
----------------------------------------------------------
System memory usage: 4 MB (peak: 4 MB)
Executed: 2024-06-09 08:10:40
Timestamp: 1717913440.3747
Execution time:0.0007----------------------------------------------------------
| Profile process: | 0.01457s | 2073.54% | 17 | * | 0.00086s |
| Profile oxNew: | 0.00664s | 944.98% | 161 | * | 4.0E-5s |
| Profile oxAutoload: | 0.00278s | 395.15% | 94 | * | 3.0E-5s |
| Profile getArticleManufacturerUri: | 0.00124s | 175.98% | 7 | * | 0.00018s |
| Profile buildTree: | 0.00097s | 138.16% | 1 | * | 0.00097s |
| Profile _getAmountPrice: | 0.00088s | 125.17% | 7 | * | 0.00013s |
| Profile loadinglists: | 0.00085s | 120.93% | 1 | * | 0.00085s |
| Profile parseThroughSmarty: | 0.0007s | 99.86% | 1 | * | 0.0007s |
| Profile seoencoder_loadFromCache: | 0.00038s | 54.1% | 50 | * | 1.0E-5s |
| Profile articleAssign: | 0.00028s | 40.26% | 7 | * | 4.0E-5s |
| Profile _assignPriceInternal: | 0.00023s | 32.02% | 7 | * | 3.0E-5s |
| Profile smarty_function_oxmultilang: | 0.00017s | 24.08% | 65 | * | 0s |
| Profile executeMaintenanceTasks: | 0.00014s | 19.78% | 1 | * | 0.00014s |
| Profile _getLangTranslationArray: | 0.00012s | 17.67% | 87 | * | 0s |
| Profile getCategoryUri: | 0.00011s | 15.47% | 14 | * | 1.0E-5s |
| Profile fround: | 2.0E-5s | 2.14% | 53 | * | 0s |
| Profile oxviewconfig::setViewConfigParam: | 1.0E-5s | 1.63% | 43 | * | 0s |
| Profile _applyVAT: | 1.0E-5s | 1.56% | 14 | * | 0s |
| Profile oxviewconfig::getViewConfigParam: | 1.0E-5s | 1.39% | 43 | * | 0s |
| Profile articleAssignParentInternal: | 1.0E-5s | 0.81% | 7 | * | 0s |
| Profile isSearchEngine: | 1.0E-5s | 0.71% | 1 | * | 1.0E-5s |
| Profile generatePageNavigation: | 1.0E-5s | 0.71% | 2 | * | 0s |
cl=oxwinformation(show/hide)
Memory usage: 3.942 MB (peak: 3.962 MB)
System memory usage: 4 MB (peak: 4 MB)
----------------------------------------------------------
System memory usage: 4 MB (peak: 4 MB)
Executed: 2024-06-09 08:10:40
Timestamp: 1717913440.3754
Execution time:0.0007----------------------------------------------------------
| Profile process: | 0.01523s | 2314.17% | 18 | * | 0.00085s |
| Profile oxNew: | 0.00673s | 1022.86% | 166 | * | 4.0E-5s |
| Profile oxAutoload: | 0.0028s | 424.93% | 95 | * | 3.0E-5s |
| Profile getArticleManufacturerUri: | 0.00124s | 187.97% | 7 | * | 0.00018s |
| Profile buildTree: | 0.00097s | 147.57% | 1 | * | 0.00097s |
| Profile _getAmountPrice: | 0.00088s | 133.7% | 7 | * | 0.00013s |
| Profile loadinglists: | 0.00085s | 129.17% | 1 | * | 0.00085s |
| Profile parseThroughSmarty: | 0.0007s | 106.67% | 1 | * | 0.0007s |
| Profile seoencoder_loadFromCache: | 0.00038s | 58.22% | 57 | * | 1.0E-5s |
| Profile articleAssign: | 0.00028s | 43.01% | 7 | * | 4.0E-5s |
| Profile _assignPriceInternal: | 0.00023s | 34.2% | 7 | * | 3.0E-5s |
| Profile smarty_function_oxmultilang: | 0.00017s | 26.45% | 67 | * | 0s |
| Profile executeMaintenanceTasks: | 0.00014s | 21.12% | 1 | * | 0.00014s |
| Profile _getLangTranslationArray: | 0.00013s | 19.17% | 90 | * | 0s |
| Profile getCategoryUri: | 0.00011s | 16.52% | 14 | * | 1.0E-5s |
| Profile fround: | 2.0E-5s | 2.28% | 53 | * | 0s |
| Profile oxviewconfig::setViewConfigParam: | 1.0E-5s | 1.74% | 45 | * | 0s |
| Profile _applyVAT: | 1.0E-5s | 1.67% | 14 | * | 0s |
| Profile oxviewconfig::getViewConfigParam: | 1.0E-5s | 1.49% | 44 | * | 0s |
| Profile articleAssignParentInternal: | 1.0E-5s | 0.87% | 7 | * | 0s |
| Profile isSearchEngine: | 1.0E-5s | 0.76% | 1 | * | 1.0E-5s |
| Profile generatePageNavigation: | 1.0E-5s | 0.76% | 2 | * | 0s |
cl=oxwmanufacturerlist(show/hide)
Memory usage: 3.999 MB (peak: 4.016 MB)
System memory usage: 4 MB (peak: 4 MB)
----------------------------------------------------------
System memory usage: 4 MB (peak: 4 MB)
Executed: 2024-06-09 08:10:40
Timestamp: 1717913440.3759
Execution time:0.0005----------------------------------------------------------
| Profile process: | 0.0157s | 3312.02% | 19 | * | 0.00083s |
| Profile oxNew: | 0.00681s | 1437.58% | 169 | * | 4.0E-5s |
| Profile oxAutoload: | 0.00282s | 593.96% | 96 | * | 3.0E-5s |
| Profile getArticleManufacturerUri: | 0.00124s | 260.97% | 7 | * | 0.00018s |
| Profile buildTree: | 0.00097s | 204.88% | 1 | * | 0.00097s |
| Profile _getAmountPrice: | 0.00088s | 185.61% | 7 | * | 0.00013s |
| Profile loadinglists: | 0.00085s | 179.33% | 1 | * | 0.00085s |
| Profile parseThroughSmarty: | 0.0007s | 148.09% | 1 | * | 0.0007s |
| Profile seoencoder_loadFromCache: | 0.00039s | 82.09% | 67 | * | 1.0E-5s |
| Profile articleAssign: | 0.00028s | 59.71% | 7 | * | 4.0E-5s |
| Profile _assignPriceInternal: | 0.00023s | 47.48% | 7 | * | 3.0E-5s |
| Profile smarty_function_oxmultilang: | 0.00018s | 38.18% | 69 | * | 0s |
| Profile executeMaintenanceTasks: | 0.00014s | 29.33% | 1 | * | 0.00014s |
| Profile _getLangTranslationArray: | 0.00013s | 27.21% | 93 | * | 0s |
| Profile getCategoryUri: | 0.00011s | 22.94% | 14 | * | 1.0E-5s |
| Profile fround: | 2.0E-5s | 3.17% | 53 | * | 0s |
| Profile oxviewconfig::setViewConfigParam: | 1.0E-5s | 2.41% | 46 | * | 0s |
| Profile _applyVAT: | 1.0E-5s | 2.31% | 14 | * | 0s |
| Profile oxviewconfig::getViewConfigParam: | 1.0E-5s | 2.06% | 44 | * | 0s |
| Profile articleAssignParentInternal: | 1.0E-5s | 1.21% | 7 | * | 0s |
| Profile isSearchEngine: | 1.0E-5s | 1.06% | 1 | * | 1.0E-5s |
| Profile generatePageNavigation: | 1.0E-5s | 1.06% | 2 | * | 0s |
cl=oxwcategorytree(show/hide)
Memory usage: 4.026 MB (peak: 4.042 MB)
System memory usage: 4 MB (peak: 4 MB)
----------------------------------------------------------
System memory usage: 4 MB (peak: 4 MB)
Executed: 2024-06-09 08:10:40
Timestamp: 1717913440.3762
Execution time:0.0003----------------------------------------------------------
| Profile process: | 0.01598s | 5531.27% | 20 | * | 0.0008s |
| Profile oxNew: | 0.00682s | 2358.99% | 172 | * | 4.0E-5s |
| Profile oxAutoload: | 0.00282s | 974.26% | 96 | * | 3.0E-5s |
| Profile getArticleManufacturerUri: | 0.00124s | 428.05% | 7 | * | 0.00018s |
| Profile buildTree: | 0.00097s | 336.06% | 1 | * | 0.00097s |
| Profile _getAmountPrice: | 0.00088s | 304.46% | 7 | * | 0.00013s |
| Profile loadinglists: | 0.00085s | 294.14% | 1 | * | 0.00085s |
| Profile parseThroughSmarty: | 0.0007s | 242.9% | 1 | * | 0.0007s |
| Profile seoencoder_loadFromCache: | 0.00039s | 134.65% | 67 | * | 1.0E-5s |
| Profile articleAssign: | 0.00028s | 97.94% | 7 | * | 4.0E-5s |
| Profile _assignPriceInternal: | 0.00023s | 77.89% | 7 | * | 3.0E-5s |
| Profile smarty_function_oxmultilang: | 0.00019s | 64.03% | 70 | * | 0s |
| Profile executeMaintenanceTasks: | 0.00014s | 48.1% | 1 | * | 0.00014s |
| Profile _getLangTranslationArray: | 0.00013s | 45.71% | 95 | * | 0s |
| Profile getCategoryUri: | 0.00011s | 37.62% | 14 | * | 1.0E-5s |
| Profile fround: | 2.0E-5s | 5.2% | 53 | * | 0s |
| Profile oxviewconfig::setViewConfigParam: | 1.0E-5s | 3.96% | 47 | * | 0s |
| Profile _applyVAT: | 1.0E-5s | 3.8% | 14 | * | 0s |
| Profile oxviewconfig::getViewConfigParam: | 1.0E-5s | 3.38% | 44 | * | 0s |
| Profile articleAssignParentInternal: | 1.0E-5s | 1.98% | 7 | * | 0s |
| Profile isSearchEngine: | 1.0E-5s | 1.73% | 1 | * | 1.0E-5s |
| Profile generatePageNavigation: | 1.0E-5s | 1.73% | 2 | * | 0s |
oxidresponsive.com - Responsive Templates & Designs für OXID Onlineshops. Weitere Informationen, Preise & Bestellen