 Sie haben Ihr Passwort vergessen?
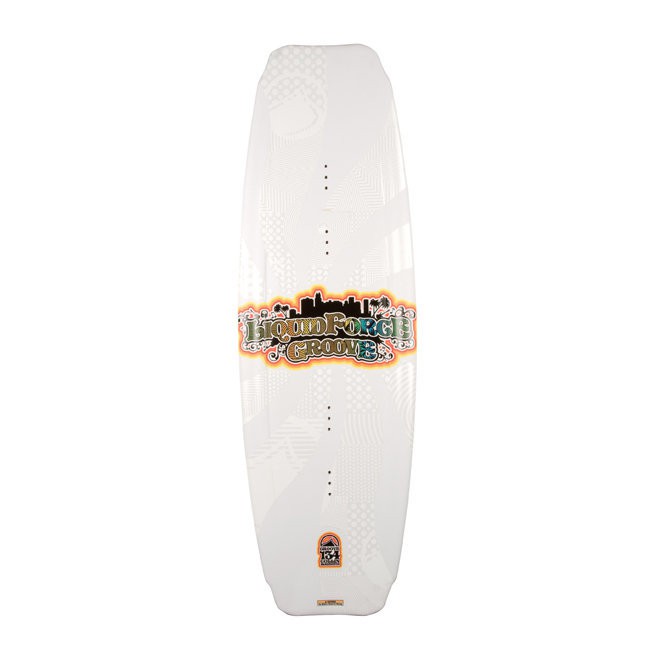
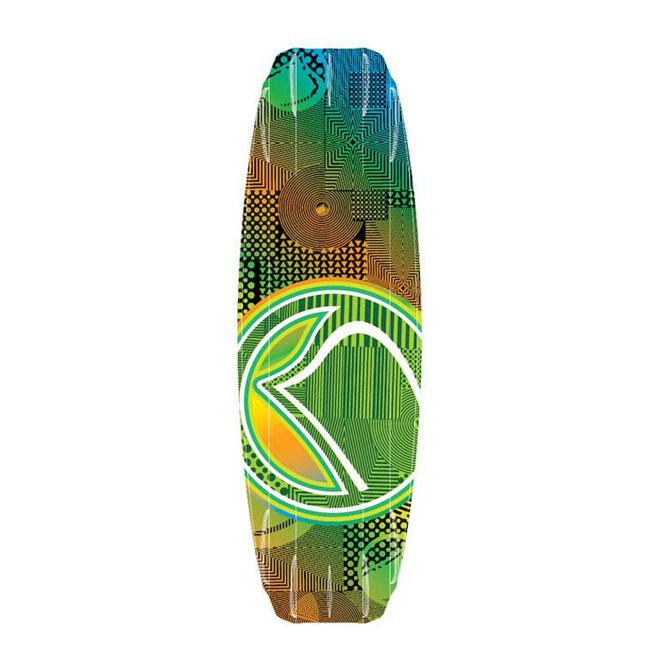
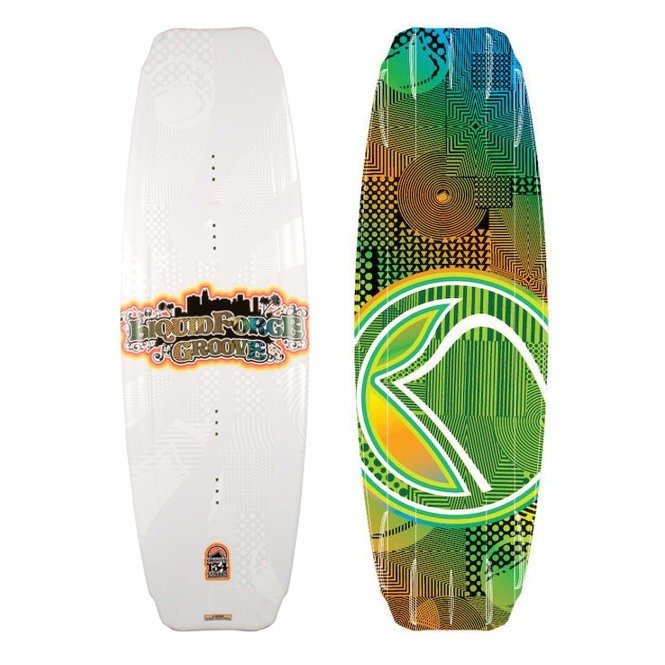
Wakeboard LIQUID FORCE GROOVE 2010


Kunden, die diesen Artikel gekauft haben, kauften auch:
-
Trapez ION SOL KITE 2011
 cl=oxwarticlebox(show/hide)Memory usage: 3.801 MB (peak: 3.862 MB)
System memory usage: 4 MB (peak: 4 MB)Executed: 2024-06-22 20:26:41Timestamp: 1719080801.6566Execution time:0.0011
----------------------------------------------------------
Profile oxNew: 0.0074s 684.54% 130 * 6.0E-5s Profile loadinglists: 0.00382s 353.46% 2 * 0.00191s Profile oxAutoload: 0.00294s 272.41% 92 * 3.0E-5s Profile process: 0.00221s 204.63% 4 * 0.00055s Profile buildTree: 0.00155s 143.56% 1 * 0.00155s Profile articleAssign: 0.00133s 122.85% 16 * 8.0E-5s Profile getCategory: 0.00068s 63.01% 2 * 0.00034s Profile _getAmountPrice: 0.00056s 51.35% 2 * 0.00028s Profile seoencoder_loadFromCache: 0.00039s 36.41% 30 * 1.0E-5s Profile getArticleManufacturerUri: 0.00034s 31.05% 6 * 6.0E-5s Profile getArticleUri: 0.0003s 27.75% 1 * 0.0003s Profile articleAssignParentInternal: 0.00023s 21.24% 16 * 1.0E-5s Profile _assignPriceInternal: 0.0002s 18.39% 2 * 0.0001s Profile executeMaintenanceTasks: 0.00014s 13.21% 1 * 0.00014s Profile _getLangTranslationArray: 0.0001s 9.09% 50 * 0s Profile smarty_function_oxmultilang: 9.0E-5s 8.71% 33 * 0s Profile fround: 1.0E-5s 1.37% 24 * 0s Profile isSearchEngine: 1.0E-5s 0.55% 1 * 1.0E-5s Profile oxviewconfig::getViewConfigParam: 1.0E-5s 0.53% 22 * 0s Profile _applyVAT: 0s 0.26% 4 * 0s Profile oxviewconfig::setViewConfigParam: 0s 0.11% 12 * 0s -
Kite CORE GTS
 cl=oxwarticlebox(show/hide)Memory usage: 3.832 MB (peak: 3.896 MB)
System memory usage: 4 MB (peak: 4 MB)Executed: 2024-06-22 20:26:41Timestamp: 1719080801.6574Execution time:0.0008
----------------------------------------------------------
Profile oxNew: 0.00741s 932.54% 137 * 5.0E-5s Profile loadinglists: 0.00382s 480.68% 2 * 0.00191s Profile process: 0.003s 377.77% 5 * 0.0006s Profile oxAutoload: 0.00294s 370.46% 92 * 3.0E-5s Profile buildTree: 0.00155s 195.23% 1 * 0.00155s Profile articleAssign: 0.00133s 167.07% 16 * 8.0E-5s Profile getCategory: 0.00068s 85.69% 2 * 0.00034s Profile _getAmountPrice: 0.00066s 82.78% 3 * 0.00022s Profile getArticleUri: 0.00055s 68.81% 2 * 0.00027s Profile seoencoder_loadFromCache: 0.0004s 49.91% 32 * 1.0E-5s Profile getArticleManufacturerUri: 0.00034s 42.23% 6 * 6.0E-5s Profile articleAssignParentInternal: 0.00023s 28.88% 16 * 1.0E-5s Profile _assignPriceInternal: 0.0002s 25.4% 3 * 7.0E-5s Profile executeMaintenanceTasks: 0.00014s 17.97% 1 * 0.00014s Profile smarty_function_oxmultilang: 0.0001s 12.99% 36 * 0s Profile _getLangTranslationArray: 0.0001s 12.87% 54 * 0s Profile fround: 2.0E-5s 2.13% 31 * 0s Profile isSearchEngine: 1.0E-5s 0.75% 1 * 1.0E-5s Profile oxviewconfig::getViewConfigParam: 1.0E-5s 0.72% 23 * 0s Profile _applyVAT: 0s 0.48% 6 * 0s Profile oxviewconfig::setViewConfigParam: 0s 0.15% 14 * 0s -
Transportcontainer THE BARREL
 24,95 € * In den Warenkorbcl=oxwarticlebox(show/hide)Memory usage: 3.864 MB (peak: 3.929 MB)
System memory usage: 4 MB (peak: 4 MB)Executed: 2024-06-22 20:26:41Timestamp: 1719080801.6582Execution time:0.0008
----------------------------------------------------------
Profile oxNew: 0.00742s 965.24% 144 * 5.0E-5s Profile loadinglists: 0.00382s 496.93% 2 * 0.00191s Profile process: 0.00377s 490.02% 6 * 0.00063s Profile oxAutoload: 0.00294s 382.98% 92 * 3.0E-5s Profile buildTree: 0.00155s 201.83% 1 * 0.00155s Profile articleAssign: 0.00133s 172.71% 16 * 8.0E-5s Profile getArticleUri: 0.00079s 103.26% 3 * 0.00026s Profile _getAmountPrice: 0.00076s 98.98% 4 * 0.00019s Profile getCategory: 0.00068s 88.59% 2 * 0.00034s Profile seoencoder_loadFromCache: 0.0004s 51.88% 34 * 1.0E-5s Profile getArticleManufacturerUri: 0.00034s 43.66% 6 * 6.0E-5s Profile articleAssignParentInternal: 0.00023s 29.86% 16 * 1.0E-5s Profile _assignPriceInternal: 0.00021s 26.67% 4 * 5.0E-5s Profile executeMaintenanceTasks: 0.00014s 18.57% 1 * 0.00014s Profile smarty_function_oxmultilang: 0.00011s 14.2% 38 * 0s Profile _getLangTranslationArray: 0.00011s 13.67% 57 * 0s Profile fround: 2.0E-5s 2.48% 37 * 0s Profile oxviewconfig::getViewConfigParam: 1.0E-5s 0.87% 24 * 0s Profile isSearchEngine: 1.0E-5s 0.78% 1 * 1.0E-5s Profile _applyVAT: 1.0E-5s 0.65% 8 * 0s Profile oxviewconfig::setViewConfigParam: 0s 0.16% 16 * 0s -
Stewart+Brown Lace Scoop Neck Tee XS | Nocturne
(2)_th.jpg) 59,90 € * In den Warenkorbcl=oxwarticlebox(show/hide)Memory usage: 3.88 MB (peak: 3.944 MB)
59,90 € * In den Warenkorbcl=oxwarticlebox(show/hide)Memory usage: 3.88 MB (peak: 3.944 MB)
System memory usage: 4 MB (peak: 4 MB)Executed: 2024-06-22 20:26:41Timestamp: 1719080801.6593Execution time:0.001
----------------------------------------------------------
Profile oxNew: 0.00744s 723.12% 151 * 5.0E-5s Profile process: 0.00479s 465.45% 7 * 0.00068s Profile loadinglists: 0.00382s 371.32% 2 * 0.00191s Profile oxAutoload: 0.00294s 286.17% 92 * 3.0E-5s Profile buildTree: 0.00155s 150.81% 1 * 0.00155s Profile articleAssign: 0.00133s 129.05% 16 * 8.0E-5s Profile getArticleUri: 0.00108s 105.14% 4 * 0.00027s Profile _getAmountPrice: 0.0009s 87.16% 5 * 0.00018s Profile getCategory: 0.00068s 66.2% 2 * 0.00034s Profile seoencoder_loadFromCache: 0.0004s 39.04% 36 * 1.0E-5s Profile getArticleManufacturerUri: 0.00034s 32.62% 6 * 6.0E-5s Profile articleAssignParentInternal: 0.00023s 22.31% 16 * 1.0E-5s Profile _assignPriceInternal: 0.00021s 20.51% 5 * 4.0E-5s Profile executeMaintenanceTasks: 0.00014s 13.88% 1 * 0.00014s Profile smarty_function_oxmultilang: 0.00012s 11.58% 40 * 0s Profile _getLangTranslationArray: 0.00011s 10.73% 60 * 0s Profile fround: 2.0E-5s 2.13% 43 * 0s Profile oxviewconfig::getViewConfigParam: 1.0E-5s 0.74% 25 * 0s Profile _applyVAT: 1.0E-5s 0.67% 10 * 0s Profile isSearchEngine: 1.0E-5s 0.58% 1 * 1.0E-5s Profile oxviewconfig::setViewConfigParam: 0s 0.21% 18 * 0s -
Kite NBK REBEL 2010
 799,00 € * In den Warenkorbcl=oxwarticlebox(show/hide)Memory usage: 3.912 MB (peak: 3.977 MB)
System memory usage: 4 MB (peak: 4 MB)Executed: 2024-06-22 20:26:41Timestamp: 1719080801.6606Execution time:0.0013
----------------------------------------------------------
Profile oxNew: 0.00746s 585.38% 158 * 5.0E-5s Profile process: 0.00606s 475.07% 8 * 0.00076s Profile loadinglists: 0.00382s 299.66% 2 * 0.00191s Profile oxAutoload: 0.00294s 230.95% 92 * 3.0E-5s Profile buildTree: 0.00155s 121.71% 1 * 0.00155s Profile getArticleUri: 0.00138s 108.23% 5 * 0.00028s Profile articleAssign: 0.00133s 104.15% 16 * 8.0E-5s Profile _getAmountPrice: 0.00103s 80.46% 6 * 0.00017s Profile getCategory: 0.00068s 53.42% 2 * 0.00034s Profile seoencoder_loadFromCache: 0.0004s 31.75% 38 * 1.0E-5s Profile getArticleManufacturerUri: 0.00034s 26.33% 6 * 6.0E-5s Profile articleAssignParentInternal: 0.00023s 18.01% 16 * 1.0E-5s Profile _assignPriceInternal: 0.00022s 16.94% 6 * 4.0E-5s Profile executeMaintenanceTasks: 0.00014s 11.2% 1 * 0.00014s Profile smarty_function_oxmultilang: 0.00013s 10.13% 42 * 0s Profile _getLangTranslationArray: 0.00011s 8.96% 63 * 0s Profile fround: 2.0E-5s 1.8% 49 * 0s Profile _applyVAT: 1.0E-5s 0.69% 12 * 0s Profile oxviewconfig::getViewConfigParam: 1.0E-5s 0.67% 26 * 0s Profile isSearchEngine: 1.0E-5s 0.47% 1 * 1.0E-5s Profile oxviewconfig::setViewConfigParam: 0s 0.36% 20 * 0s
Schon gesehen?
-

-
Wakeboard LIQUID FORCE S4 2010
389,00 € * -
Wakeboard LIQUID FORCE SHANE 2010
389,00 € * -
Bindung O'BRIEN DECADE CT 2010
359,00 € * -
Bindung LIQUID FORCE INDEX BOOT 2010
159,00 € * -
Helm AHM 5000
45,00 € *
cl=oxwarticlebox(show/hide)
Memory usage: 4.028 MB (peak: 4.077 MB)
System memory usage: 4 MB (peak: 4 MB)
----------------------------------------------------------
System memory usage: 4 MB (peak: 4 MB)
Executed: 2024-06-22 20:26:41
Timestamp: 1719080801.6639
Execution time:0.001----------------------------------------------------------
| Profile process: | 0.00875s | 914.74% | 10 | * | 0.00087s |
| Profile oxNew: | 0.00802s | 838.5% | 169 | * | 5.0E-5s |
| Profile loadinglists: | 0.00382s | 399.65% | 2 | * | 0.00191s |
| Profile oxAutoload: | 0.00309s | 323.19% | 94 | * | 3.0E-5s |
| Profile buildTree: | 0.00155s | 162.32% | 1 | * | 0.00155s |
| Profile getArticleUri: | 0.00138s | 144.34% | 5 | * | 0.00028s |
| Profile articleAssign: | 0.00133s | 138.9% | 16 | * | 8.0E-5s |
| Profile _getAmountPrice: | 0.00122s | 127.81% | 7 | * | 0.00017s |
| Profile getCategory: | 0.00068s | 71.25% | 2 | * | 0.00034s |
| Profile seoencoder_loadFromCache: | 0.00041s | 42.44% | 40 | * | 1.0E-5s |
| Profile getArticleManufacturerUri: | 0.00034s | 35.11% | 6 | * | 6.0E-5s |
| Profile getArticleMainUri: | 0.00028s | 29.5% | 1 | * | 0.00028s |
| Profile articleAssignParentInternal: | 0.00023s | 24.01% | 16 | * | 1.0E-5s |
| Profile _assignPriceInternal: | 0.00022s | 23.02% | 7 | * | 3.0E-5s |
| Profile smarty_function_oxmultilang: | 0.00015s | 16.01% | 46 | * | 0s |
| Profile executeMaintenanceTasks: | 0.00014s | 14.94% | 1 | * | 0.00014s |
| Profile _getLangTranslationArray: | 0.00012s | 12.97% | 69 | * | 0s |
| Profile fround: | 2.0E-5s | 2.39% | 52 | * | 0s |
| Profile _applyVAT: | 1.0E-5s | 1.02% | 13 | * | 0s |
| Profile oxviewconfig::getViewConfigParam: | 1.0E-5s | 0.9% | 29 | * | 0s |
| Profile isSearchEngine: | 1.0E-5s | 0.62% | 1 | * | 1.0E-5s |
| Profile oxviewconfig::setViewConfigParam: | 0s | 0.47% | 24 | * | 0s |

cl=oxwarticlebox(show/hide)
Memory usage: 4.044 MB (peak: 4.092 MB)
System memory usage: 4 MB (peak: 4 MB)
----------------------------------------------------------
System memory usage: 4 MB (peak: 4 MB)
Executed: 2024-06-22 20:26:41
Timestamp: 1719080801.6648
Execution time:0.0008----------------------------------------------------------
| Profile process: | 0.00954s | 1194.15% | 11 | * | 0.00087s |
| Profile oxNew: | 0.00803s | 1004.6% | 175 | * | 5.0E-5s |
| Profile loadinglists: | 0.00382s | 478.25% | 2 | * | 0.00191s |
| Profile oxAutoload: | 0.00309s | 386.75% | 94 | * | 3.0E-5s |
| Profile buildTree: | 0.00155s | 194.24% | 1 | * | 0.00155s |
| Profile getArticleUri: | 0.00138s | 172.72% | 5 | * | 0.00028s |
| Profile articleAssign: | 0.00133s | 166.22% | 16 | * | 8.0E-5s |
| Profile _getAmountPrice: | 0.00133s | 166.22% | 8 | * | 0.00017s |
| Profile getCategory: | 0.00068s | 85.26% | 2 | * | 0.00034s |
| Profile getArticleMainUri: | 0.00059s | 73.86% | 2 | * | 0.0003s |
| Profile seoencoder_loadFromCache: | 0.00041s | 50.79% | 42 | * | 1.0E-5s |
| Profile getArticleManufacturerUri: | 0.00034s | 42.02% | 6 | * | 6.0E-5s |
| Profile articleAssignParentInternal: | 0.00023s | 28.74% | 16 | * | 1.0E-5s |
| Profile _assignPriceInternal: | 0.00022s | 27.93% | 8 | * | 3.0E-5s |
| Profile smarty_function_oxmultilang: | 0.00015s | 19.16% | 46 | * | 0s |
| Profile executeMaintenanceTasks: | 0.00014s | 17.88% | 1 | * | 0.00014s |
| Profile _getLangTranslationArray: | 0.00012s | 15.64% | 70 | * | 0s |
| Profile fround: | 2.0E-5s | 2.86% | 55 | * | 0s |
| Profile _applyVAT: | 1.0E-5s | 1.37% | 14 | * | 0s |
| Profile oxviewconfig::getViewConfigParam: | 1.0E-5s | 1.07% | 30 | * | 0s |
| Profile isSearchEngine: | 1.0E-5s | 0.75% | 1 | * | 1.0E-5s |
| Profile oxviewconfig::setViewConfigParam: | 0s | 0.57% | 26 | * | 0s |

cl=oxwarticlebox(show/hide)
Memory usage: 4.074 MB (peak: 4.123 MB)
System memory usage: 4 MB (peak: 4 MB)
----------------------------------------------------------
System memory usage: 4 MB (peak: 4 MB)
Executed: 2024-06-22 20:26:41
Timestamp: 1719080801.6655
Execution time:0.0007----------------------------------------------------------
| Profile process: | 0.01024s | 1451.03% | 12 | * | 0.00085s |
| Profile oxNew: | 0.00804s | 1138.2% | 181 | * | 4.0E-5s |
| Profile loadinglists: | 0.00382s | 541.24% | 2 | * | 0.00191s |
| Profile oxAutoload: | 0.00309s | 437.69% | 94 | * | 3.0E-5s |
| Profile buildTree: | 0.00155s | 219.82% | 1 | * | 0.00155s |
| Profile _getAmountPrice: | 0.00143s | 201.99% | 9 | * | 0.00016s |
| Profile getArticleUri: | 0.00138s | 195.47% | 5 | * | 0.00028s |
| Profile articleAssign: | 0.00133s | 188.11% | 16 | * | 8.0E-5s |
| Profile getArticleMainUri: | 0.00083s | 117.6% | 3 | * | 0.00028s |
| Profile getCategory: | 0.00068s | 96.49% | 2 | * | 0.00034s |
| Profile seoencoder_loadFromCache: | 0.00041s | 57.75% | 44 | * | 1.0E-5s |
| Profile getArticleManufacturerUri: | 0.00034s | 47.55% | 6 | * | 6.0E-5s |
| Profile articleAssignParentInternal: | 0.00023s | 32.52% | 16 | * | 1.0E-5s |
| Profile _assignPriceInternal: | 0.00023s | 32.02% | 9 | * | 3.0E-5s |
| Profile smarty_function_oxmultilang: | 0.00015s | 21.68% | 46 | * | 0s |
| Profile executeMaintenanceTasks: | 0.00014s | 20.23% | 1 | * | 0.00014s |
| Profile _getLangTranslationArray: | 0.00013s | 17.83% | 71 | * | 0s |
| Profile fround: | 2.0E-5s | 3.24% | 58 | * | 0s |
| Profile _applyVAT: | 1.0E-5s | 1.69% | 15 | * | 0s |
| Profile oxviewconfig::getViewConfigParam: | 1.0E-5s | 1.22% | 31 | * | 0s |
| Profile isSearchEngine: | 1.0E-5s | 0.84% | 1 | * | 1.0E-5s |
| Profile oxviewconfig::setViewConfigParam: | 0s | 0.64% | 28 | * | 0s |

cl=oxwarticlebox(show/hide)
Memory usage: 4.105 MB (peak: 4.153 MB)
System memory usage: 4 MB (peak: 4 MB)
----------------------------------------------------------
System memory usage: 4 MB (peak: 4 MB)
Executed: 2024-06-22 20:26:41
Timestamp: 1719080801.6666
Execution time:0.001----------------------------------------------------------
| Profile process: | 0.01124s | 1125.78% | 13 | * | 0.00086s |
| Profile oxNew: | 0.00805s | 806.5% | 187 | * | 4.0E-5s |
| Profile loadinglists: | 0.00382s | 382.85% | 2 | * | 0.00191s |
| Profile oxAutoload: | 0.00309s | 309.6% | 94 | * | 3.0E-5s |
| Profile _getAmountPrice: | 0.00156s | 156.21% | 10 | * | 0.00016s |
| Profile buildTree: | 0.00155s | 155.49% | 1 | * | 0.00155s |
| Profile getArticleUri: | 0.00138s | 138.27% | 5 | * | 0.00028s |
| Profile articleAssign: | 0.00133s | 133.06% | 16 | * | 8.0E-5s |
| Profile getArticleMainUri: | 0.00113s | 113.14% | 4 | * | 0.00028s |
| Profile getCategory: | 0.00068s | 68.25% | 2 | * | 0.00034s |
| Profile seoencoder_loadFromCache: | 0.00041s | 41.16% | 46 | * | 1.0E-5s |
| Profile getArticleManufacturerUri: | 0.00034s | 33.64% | 6 | * | 6.0E-5s |
| Profile _assignPriceInternal: | 0.00023s | 23.24% | 10 | * | 2.0E-5s |
| Profile articleAssignParentInternal: | 0.00023s | 23.01% | 16 | * | 1.0E-5s |
| Profile smarty_function_oxmultilang: | 0.00015s | 15.34% | 46 | * | 0s |
| Profile executeMaintenanceTasks: | 0.00014s | 14.31% | 1 | * | 0.00014s |
| Profile _getLangTranslationArray: | 0.00013s | 12.8% | 72 | * | 0s |
| Profile fround: | 2.0E-5s | 2.29% | 61 | * | 0s |
| Profile _applyVAT: | 1.0E-5s | 1.39% | 16 | * | 0s |
| Profile oxviewconfig::getViewConfigParam: | 1.0E-5s | 0.96% | 32 | * | 0s |
| Profile isSearchEngine: | 1.0E-5s | 0.6% | 1 | * | 1.0E-5s |
| Profile oxviewconfig::setViewConfigParam: | 0s | 0.45% | 30 | * | 0s |

cl=oxwarticlebox(show/hide)
Memory usage: 4.136 MB (peak: 4.185 MB)
System memory usage: 4 MB (peak: 4 MB)
----------------------------------------------------------
System memory usage: 4 MB (peak: 4 MB)
Executed: 2024-06-22 20:26:41
Timestamp: 1719080801.6674
Execution time:0.0008----------------------------------------------------------
| Profile process: | 0.01201s | 1550.82% | 14 | * | 0.00086s |
| Profile oxNew: | 0.00806s | 1040.87% | 193 | * | 4.0E-5s |
| Profile loadinglists: | 0.00382s | 493.56% | 2 | * | 0.00191s |
| Profile oxAutoload: | 0.00309s | 399.14% | 94 | * | 3.0E-5s |
| Profile _getAmountPrice: | 0.00166s | 214.69% | 11 | * | 0.00015s |
| Profile buildTree: | 0.00155s | 200.46% | 1 | * | 0.00155s |
| Profile getArticleMainUri: | 0.00138s | 178.53% | 5 | * | 0.00028s |
| Profile getArticleUri: | 0.00138s | 178.26% | 5 | * | 0.00028s |
| Profile articleAssign: | 0.00133s | 171.54% | 16 | * | 8.0E-5s |
| Profile getCategory: | 0.00068s | 87.99% | 2 | * | 0.00034s |
| Profile seoencoder_loadFromCache: | 0.00041s | 53.34% | 48 | * | 1.0E-5s |
| Profile getArticleManufacturerUri: | 0.00034s | 43.36% | 6 | * | 6.0E-5s |
| Profile _assignPriceInternal: | 0.00024s | 30.37% | 11 | * | 2.0E-5s |
| Profile articleAssignParentInternal: | 0.00023s | 29.66% | 16 | * | 1.0E-5s |
| Profile smarty_function_oxmultilang: | 0.00015s | 19.77% | 46 | * | 0s |
| Profile executeMaintenanceTasks: | 0.00014s | 18.45% | 1 | * | 0.00014s |
| Profile _getLangTranslationArray: | 0.00013s | 16.75% | 73 | * | 0s |
| Profile fround: | 2.0E-5s | 3.08% | 64 | * | 0s |
| Profile _applyVAT: | 1.0E-5s | 1.91% | 17 | * | 0s |
| Profile oxviewconfig::getViewConfigParam: | 1.0E-5s | 1.36% | 33 | * | 0s |
| Profile isSearchEngine: | 1.0E-5s | 0.77% | 1 | * | 1.0E-5s |
| Profile oxviewconfig::setViewConfigParam: | 0s | 0.59% | 32 | * | 0s |
cl=oxwarticledetails(show/hide)
Memory usage: 4.308 MB (peak: 4.633 MB)
System memory usage: 4 MB (peak: 4 MB)
----------------------------------------------------------
System memory usage: 4 MB (peak: 4 MB)
Executed: 2024-06-22 20:26:41
Timestamp: 1719080801.6685
Execution time:0.0019----------------------------------------------------------
| Profile process: | 0.01386s | 744.76% | 14 | * | 0.00099s |
| Profile oxNew: | 0.00806s | 433.28% | 196 | * | 4.0E-5s |
| Profile loadinglists: | 0.00438s | 235.4% | 3 | * | 0.00146s |
| Profile oxAutoload: | 0.00309s | 166.03% | 94 | * | 3.0E-5s |
| Profile _getAmountPrice: | 0.00166s | 89.3% | 11 | * | 0.00015s |
| Profile buildTree: | 0.00155s | 83.38% | 1 | * | 0.00155s |
| Profile getArticleMainUri: | 0.00138s | 74.26% | 5 | * | 0.00028s |
| Profile getArticleUri: | 0.00138s | 74.15% | 5 | * | 0.00028s |
| Profile articleAssign: | 0.00133s | 71.36% | 16 | * | 8.0E-5s |
| Profile getCategory: | 0.00068s | 36.6% | 2 | * | 0.00034s |
| Profile seoencoder_loadFromCache: | 0.00041s | 22.19% | 48 | * | 1.0E-5s |
| Profile getArticleManufacturerUri: | 0.00034s | 18.04% | 6 | * | 6.0E-5s |
| Profile _assignPriceInternal: | 0.00024s | 12.63% | 11 | * | 2.0E-5s |
| Profile articleAssignParentInternal: | 0.00023s | 12.34% | 16 | * | 1.0E-5s |
| Profile smarty_function_oxmultilang: | 0.00015s | 8.22% | 46 | * | 0s |
| Profile executeMaintenanceTasks: | 0.00014s | 7.67% | 1 | * | 0.00014s |
| Profile _getLangTranslationArray: | 0.00013s | 7.19% | 75 | * | 0s |
| Profile fround: | 2.0E-5s | 1.28% | 64 | * | 0s |
| Profile _applyVAT: | 1.0E-5s | 0.79% | 17 | * | 0s |
| Profile oxviewconfig::getViewConfigParam: | 1.0E-5s | 0.56% | 33 | * | 0s |
| Profile isSearchEngine: | 1.0E-5s | 0.32% | 1 | * | 1.0E-5s |
| Profile oxviewconfig::setViewConfigParam: | 0s | 0.24% | 32 | * | 0s |