 Sie haben Ihr Passwort vergessen?
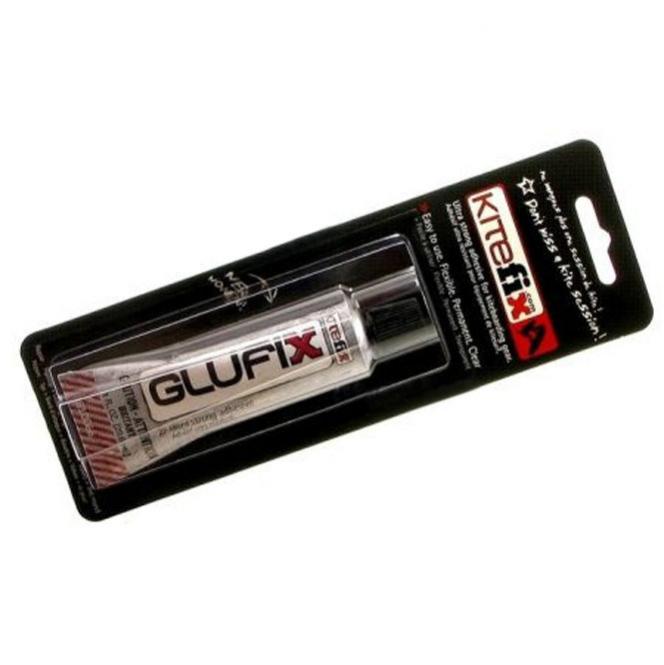
KiteFix Kleber GLUFIX (30g)
Artikel zurück
Artikel 6 VON 6
Kunden, die diesen Artikel gekauft haben, kauften auch:
-
Kite CORE GTS
 cl=oxwarticlebox(show/hide)Memory usage: 3.492 MB (peak: 3.554 MB)
System memory usage: 2 MB (peak: 2 MB)Executed: 2024-05-18 00:03:53Timestamp: 1715983433.6825Execution time:0.0016
----------------------------------------------------------
Profile oxNew: 0.01138s 690.28% 126 * 9.0E-5s Profile oxAutoload: 0.00429s 260.3% 93 * 5.0E-5s Profile process: 0.0026s 157.54% 4 * 0.00065s Profile loadinglists: 0.00249s 151.29% 3 * 0.00083s Profile buildTree: 0.00202s 122.76% 1 * 0.00202s Profile articleAssign: 0.0008s 48.71% 8 * 0.0001s Profile getArticleUri: 0.00063s 38.3% 5 * 0.00013s Profile _getAmountPrice: 0.00052s 31.6% 2 * 0.00026s Profile seoencoder_loadFromCache: 0.00045s 27.3% 27 * 2.0E-5s Profile executeMaintenanceTasks: 0.00032s 19.43% 1 * 0.00032s Profile getArticleMainUri: 0.00018s 10.87% 1 * 0.00018s Profile _assignPriceInternal: 0.00017s 10.19% 2 * 8.0E-5s Profile _getLangTranslationArray: 0.00017s 10.16% 49 * 0s Profile smarty_function_oxmultilang: 0.0001s 5.9% 31 * 0s Profile getCategoryUri: 9.0E-5s 5.27% 2 * 4.0E-5s Profile fround: 2.0E-5s 0.95% 26 * 0s Profile _applyVAT: 1.0E-5s 0.41% 4 * 0s Profile isSearchEngine: 1.0E-5s 0.36% 1 * 1.0E-5s Profile articleAssignParentInternal: 1.0E-5s 0.36% 8 * 0s Profile oxviewconfig::getViewConfigParam: 0s 0.29% 22 * 0s Profile oxviewconfig::setViewConfigParam: 0s 0.12% 12 * 0s -
Kite NBK EVO 2010
 699,00 € * In den Warenkorbcl=oxwarticlebox(show/hide)Memory usage: 3.524 MB (peak: 3.589 MB)
System memory usage: 2 MB (peak: 2 MB)Executed: 2024-05-18 00:03:53Timestamp: 1715983433.6844Execution time:0.0018
----------------------------------------------------------
Profile oxNew: 0.0114s 620.32% 133 * 9.0E-5s Profile process: 0.00443s 241.05% 5 * 0.00089s Profile oxAutoload: 0.00429s 233.51% 93 * 5.0E-5s Profile loadinglists: 0.00249s 135.72% 3 * 0.00083s Profile buildTree: 0.00202s 110.12% 1 * 0.00202s Profile getArticleUri: 0.00153s 83.23% 6 * 0.00025s Profile articleAssign: 0.0008s 43.7% 8 * 0.0001s Profile _getAmountPrice: 0.00062s 33.51% 3 * 0.00021s Profile seoencoder_loadFromCache: 0.00045s 24.7% 30 * 2.0E-5s Profile getArticleMainUri: 0.00042s 22.65% 2 * 0.00021s Profile executeMaintenanceTasks: 0.00032s 17.43% 1 * 0.00032s Profile _assignPriceInternal: 0.00017s 9.46% 3 * 6.0E-5s Profile _getLangTranslationArray: 0.00017s 9.33% 52 * 0s Profile smarty_function_oxmultilang: 0.00011s 5.74% 33 * 0s Profile getCategoryUri: 9.0E-5s 4.72% 2 * 4.0E-5s Profile fround: 2.0E-5s 0.91% 32 * 0s Profile _applyVAT: 1.0E-5s 0.48% 6 * 0s Profile isSearchEngine: 1.0E-5s 0.32% 1 * 1.0E-5s Profile articleAssignParentInternal: 1.0E-5s 0.32% 8 * 0s Profile oxviewconfig::getViewConfigParam: 0s 0.26% 23 * 0s Profile oxviewconfig::setViewConfigParam: 0s 0.1% 14 * 0s -
Trapez ION SOL KITE 2011
 cl=oxwarticlebox(show/hide)Memory usage: 3.541 MB (peak: 3.605 MB)
System memory usage: 2 MB (peak: 2 MB)Executed: 2024-05-18 00:03:53Timestamp: 1715983433.686Execution time:0.0015
----------------------------------------------------------
Profile oxNew: 0.01141s 751.26% 140 * 8.0E-5s Profile process: 0.00594s 391.01% 6 * 0.00099s Profile oxAutoload: 0.00429s 282.36% 93 * 5.0E-5s Profile loadinglists: 0.00249s 164.11% 3 * 0.00083s Profile getArticleUri: 0.00215s 141.45% 7 * 0.00031s Profile buildTree: 0.00202s 133.16% 1 * 0.00202s Profile articleAssign: 0.0008s 52.84% 8 * 0.0001s Profile _getAmountPrice: 0.0007s 46.17% 4 * 0.00018s Profile getArticleMainUri: 0.00063s 41.48% 3 * 0.00021s Profile seoencoder_loadFromCache: 0.00046s 30.19% 33 * 1.0E-5s Profile executeMaintenanceTasks: 0.00032s 21.08% 1 * 0.00032s Profile _assignPriceInternal: 0.00018s 11.77% 4 * 4.0E-5s Profile _getLangTranslationArray: 0.00018s 11.6% 56 * 0s Profile smarty_function_oxmultilang: 0.00012s 7.72% 36 * 0s Profile getCategoryUri: 9.0E-5s 5.71% 2 * 4.0E-5s Profile fround: 2.0E-5s 1.1% 39 * 0s Profile _applyVAT: 1.0E-5s 0.64% 8 * 0s Profile isSearchEngine: 1.0E-5s 0.39% 1 * 1.0E-5s Profile articleAssignParentInternal: 1.0E-5s 0.39% 8 * 0s Profile oxviewconfig::getViewConfigParam: 0s 0.31% 24 * 0s Profile oxviewconfig::setViewConfigParam: 0s 0.19% 16 * 0s -
Bindung O'BRIEN DECADE CT 2010
 cl=oxwarticlebox(show/hide)Memory usage: 3.574 MB (peak: 3.638 MB)
System memory usage: 2 MB (peak: 2 MB)Executed: 2024-05-18 00:03:53Timestamp: 1715983433.688Execution time:0.002
----------------------------------------------------------
Profile oxNew: 0.01143s 578.05% 147 * 8.0E-5s Profile process: 0.00791s 400.08% 7 * 0.00113s Profile oxAutoload: 0.00429s 216.88% 93 * 5.0E-5s Profile getArticleUri: 0.0031s 156.58% 8 * 0.00039s Profile loadinglists: 0.00249s 126.05% 3 * 0.00083s Profile buildTree: 0.00202s 102.28% 1 * 0.00202s Profile getArticleMainUri: 0.00092s 46.47% 4 * 0.00023s Profile articleAssign: 0.0008s 40.59% 8 * 0.0001s Profile _getAmountPrice: 0.0008s 40.47% 5 * 0.00016s Profile seoencoder_loadFromCache: 0.00046s 23.45% 36 * 1.0E-5s Profile executeMaintenanceTasks: 0.00032s 16.19% 1 * 0.00032s Profile _assignPriceInternal: 0.00018s 9.29% 5 * 4.0E-5s Profile _getLangTranslationArray: 0.00018s 9.12% 60 * 0s Profile smarty_function_oxmultilang: 0.00013s 6.49% 39 * 0s Profile getCategoryUri: 9.0E-5s 4.39% 2 * 4.0E-5s Profile fround: 2.0E-5s 0.84% 46 * 0s Profile _applyVAT: 1.0E-5s 0.59% 10 * 0s Profile isSearchEngine: 1.0E-5s 0.3% 1 * 1.0E-5s Profile articleAssignParentInternal: 1.0E-5s 0.3% 8 * 0s Profile oxviewconfig::getViewConfigParam: 1.0E-5s 0.29% 25 * 0s Profile oxviewconfig::setViewConfigParam: 0s 0.14% 18 * 0s -
Kuyichi Ledergürtel JEVER
 cl=oxwarticlebox(show/hide)Memory usage: 3.607 MB (peak: 3.671 MB)
System memory usage: 2 MB (peak: 2 MB)Executed: 2024-05-18 00:03:53Timestamp: 1715983433.6895Execution time:0.0014
----------------------------------------------------------
Profile oxNew: 0.01145s 790.23% 154 * 7.0E-5s Profile process: 0.00936s 645.66% 8 * 0.00117s Profile oxAutoload: 0.00429s 296.02% 93 * 5.0E-5s Profile getArticleUri: 0.00372s 256.5% 9 * 0.00041s Profile loadinglists: 0.00249s 172.05% 3 * 0.00083s Profile buildTree: 0.00202s 139.6% 1 * 0.00202s Profile getArticleMainUri: 0.00113s 77.9% 5 * 0.00023s Profile _getAmountPrice: 0.00089s 61.52% 6 * 0.00015s Profile articleAssign: 0.0008s 55.4% 8 * 0.0001s Profile seoencoder_loadFromCache: 0.00047s 32.33% 39 * 1.0E-5s Profile executeMaintenanceTasks: 0.00032s 22.1% 1 * 0.00032s Profile _assignPriceInternal: 0.00019s 12.96% 6 * 3.0E-5s Profile _getLangTranslationArray: 0.00018s 12.73% 64 * 0s Profile smarty_function_oxmultilang: 0.00014s 9.61% 42 * 0s Profile getCategoryUri: 9.0E-5s 5.99% 2 * 4.0E-5s Profile fround: 2.0E-5s 1.32% 53 * 0s Profile _applyVAT: 1.0E-5s 0.95% 12 * 0s Profile isSearchEngine: 1.0E-5s 0.41% 1 * 1.0E-5s Profile articleAssignParentInternal: 1.0E-5s 0.41% 8 * 0s Profile oxviewconfig::getViewConfigParam: 1.0E-5s 0.39% 26 * 0s Profile oxviewconfig::setViewConfigParam: 0s 0.2% 20 * 0s
cl=oxwarticledetails(show/hide)
Memory usage: 3.735 MB (peak: 3.934 MB)
System memory usage: 4 MB (peak: 4 MB)
----------------------------------------------------------
System memory usage: 4 MB (peak: 4 MB)
Executed: 2024-05-18 00:03:53
Timestamp: 1715983433.6923
Execution time:0.0027----------------------------------------------------------
| Profile process: | 0.01301s | 475.69% | 9 | * | 0.00145s |
| Profile oxNew: | 0.01174s | 429.18% | 164 | * | 7.0E-5s |
| Profile oxAutoload: | 0.00436s | 159.31% | 95 | * | 5.0E-5s |
| Profile getArticleUri: | 0.00372s | 135.86% | 9 | * | 0.00041s |
| Profile loadinglists: | 0.00344s | 125.64% | 5 | * | 0.00069s |
| Profile buildTree: | 0.00202s | 73.94% | 1 | * | 0.00202s |
| Profile getArticleMainUri: | 0.00113s | 41.26% | 5 | * | 0.00023s |
| Profile _getAmountPrice: | 0.00089s | 32.58% | 6 | * | 0.00015s |
| Profile articleAssign: | 0.0008s | 29.34% | 8 | * | 0.0001s |
| Profile seoencoder_loadFromCache: | 0.00047s | 17.12% | 39 | * | 1.0E-5s |
| Profile executeMaintenanceTasks: | 0.00032s | 11.7% | 1 | * | 0.00032s |
| Profile _getLangTranslationArray: | 0.00019s | 7.1% | 70 | * | 0s |
| Profile _assignPriceInternal: | 0.00019s | 6.87% | 6 | * | 3.0E-5s |
| Profile smarty_function_oxmultilang: | 0.00015s | 5.56% | 45 | * | 0s |
| Profile getCategoryUri: | 9.0E-5s | 3.17% | 2 | * | 4.0E-5s |
| Profile fround: | 2.0E-5s | 0.7% | 53 | * | 0s |
| Profile _applyVAT: | 1.0E-5s | 0.51% | 12 | * | 0s |
| Profile isSearchEngine: | 1.0E-5s | 0.22% | 1 | * | 1.0E-5s |
| Profile articleAssignParentInternal: | 1.0E-5s | 0.22% | 8 | * | 0s |
| Profile oxviewconfig::getViewConfigParam: | 1.0E-5s | 0.21% | 28 | * | 0s |
| Profile oxviewconfig::setViewConfigParam: | 0s | 0.14% | 23 | * | 0s |