 Sie haben Ihr Passwort vergessen?
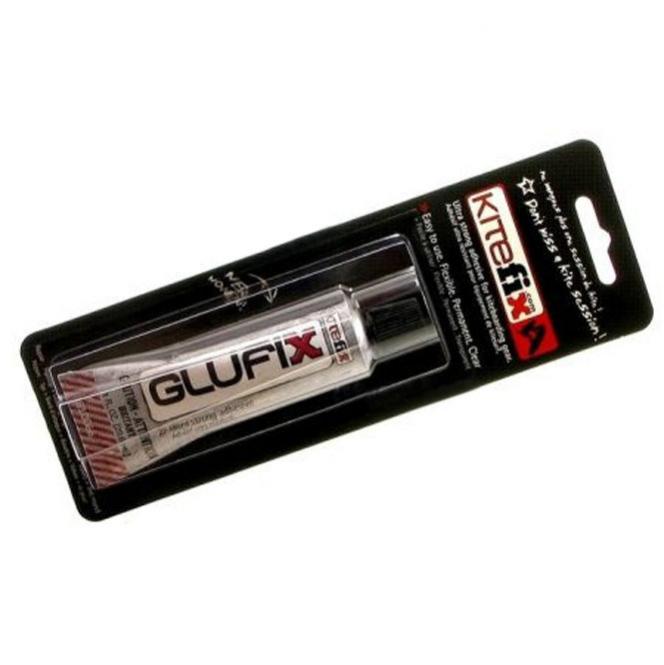
KiteFix Kleber GLUFIX (30g)
Artikel zurück
Artikel 6 VON 6
Kunden, die diesen Artikel gekauft haben, kauften auch:
-
Kite CORE GTS
 cl=oxwarticlebox(show/hide)Memory usage: 3.494 MB (peak: 3.556 MB)
System memory usage: 2 MB (peak: 2 MB)Executed: 2024-06-02 11:35:34Timestamp: 1717320934.2584Execution time:0.0013
----------------------------------------------------------
Profile oxNew: 0.00961s 727.16% 126 * 8.0E-5s Profile oxAutoload: 0.0038s 287.87% 93 * 4.0E-5s Profile buildTree: 0.00244s 184.46% 1 * 0.00244s Profile process: 0.00215s 162.46% 4 * 0.00054s Profile loadinglists: 0.00195s 147.52% 3 * 0.00065s Profile articleAssign: 0.00061s 46.42% 8 * 8.0E-5s Profile getArticleUri: 0.00059s 44.38% 5 * 0.00012s Profile seoencoder_loadFromCache: 0.00046s 35.1% 27 * 2.0E-5s Profile _getAmountPrice: 0.00035s 26.49% 2 * 0.00017s Profile executeMaintenanceTasks: 0.0003s 22.94% 1 * 0.0003s Profile getArticleMainUri: 0.00015s 11.06% 1 * 0.00015s Profile getCategoryUri: 0.00012s 9.46% 2 * 6.0E-5s Profile _getLangTranslationArray: 0.0001s 7.42% 49 * 0s Profile smarty_function_oxmultilang: 9.0E-5s 6.66% 31 * 0s Profile _assignPriceInternal: 8.0E-5s 6.41% 2 * 4.0E-5s Profile fround: 1.0E-5s 1.08% 26 * 0s Profile isSearchEngine: 1.0E-5s 0.61% 1 * 1.0E-5s Profile _applyVAT: 0s 0.31% 4 * 0s Profile oxviewconfig::getViewConfigParam: 0s 0.23% 22 * 0s Profile articleAssignParentInternal: 0s 0.22% 8 * 0s Profile oxviewconfig::setViewConfigParam: 0s 0.14% 12 * 0s -
Kite NBK EVO 2010
 699,00 € * In den Warenkorbcl=oxwarticlebox(show/hide)Memory usage: 3.526 MB (peak: 3.591 MB)
System memory usage: 2 MB (peak: 2 MB)Executed: 2024-06-02 11:35:34Timestamp: 1717320934.2594Execution time:0.001
----------------------------------------------------------
Profile oxNew: 0.00962s 933.33% 133 * 7.0E-5s Profile oxAutoload: 0.0038s 369.15% 93 * 4.0E-5s Profile process: 0.00317s 307.82% 5 * 0.00063s Profile buildTree: 0.00244s 236.54% 1 * 0.00244s Profile loadinglists: 0.00195s 189.17% 3 * 0.00065s Profile getArticleUri: 0.001s 97.29% 6 * 0.00017s Profile articleAssign: 0.00061s 59.52% 8 * 8.0E-5s Profile seoencoder_loadFromCache: 0.00046s 45.11% 30 * 2.0E-5s Profile _getAmountPrice: 0.00041s 39.71% 3 * 0.00014s Profile executeMaintenanceTasks: 0.0003s 29.41% 1 * 0.0003s Profile getArticleMainUri: 0.00028s 27.19% 2 * 0.00014s Profile getCategoryUri: 0.00012s 12.13% 2 * 6.0E-5s Profile _getLangTranslationArray: 0.0001s 9.6% 52 * 0s Profile smarty_function_oxmultilang: 9.0E-5s 9.03% 33 * 0s Profile _assignPriceInternal: 9.0E-5s 8.52% 3 * 3.0E-5s Profile fround: 2.0E-5s 1.57% 32 * 0s Profile isSearchEngine: 1.0E-5s 0.79% 1 * 1.0E-5s Profile _applyVAT: 0s 0.39% 6 * 0s Profile oxviewconfig::getViewConfigParam: 0s 0.3% 23 * 0s Profile articleAssignParentInternal: 0s 0.28% 8 * 0s Profile oxviewconfig::setViewConfigParam: 0s 0.19% 14 * 0s -
Trapez ION SOL KITE 2011
 cl=oxwarticlebox(show/hide)Memory usage: 3.543 MB (peak: 3.607 MB)
System memory usage: 2 MB (peak: 2 MB)Executed: 2024-06-02 11:35:34Timestamp: 1717320934.2605Execution time:0.001
----------------------------------------------------------
Profile oxNew: 0.00962s 932.48% 140 * 7.0E-5s Profile process: 0.0042s 406.77% 6 * 0.0007s Profile oxAutoload: 0.0038s 368.47% 93 * 4.0E-5s Profile buildTree: 0.00244s 236.11% 1 * 0.00244s Profile loadinglists: 0.00195s 188.82% 3 * 0.00065s Profile getArticleUri: 0.00141s 136.27% 7 * 0.0002s Profile articleAssign: 0.00061s 59.41% 8 * 8.0E-5s Profile _getAmountPrice: 0.00049s 47.89% 4 * 0.00012s Profile seoencoder_loadFromCache: 0.00047s 45.21% 33 * 1.0E-5s Profile getArticleMainUri: 0.00041s 39.55% 3 * 0.00014s Profile executeMaintenanceTasks: 0.0003s 29.36% 1 * 0.0003s Profile getCategoryUri: 0.00012s 12.1% 2 * 6.0E-5s Profile _getLangTranslationArray: 0.0001s 9.98% 56 * 0s Profile smarty_function_oxmultilang: 0.0001s 9.68% 36 * 0s Profile _assignPriceInternal: 9.0E-5s 8.78% 4 * 2.0E-5s Profile fround: 2.0E-5s 1.66% 39 * 0s Profile isSearchEngine: 1.0E-5s 0.79% 1 * 1.0E-5s Profile _applyVAT: 1.0E-5s 0.51% 8 * 0s Profile oxviewconfig::getViewConfigParam: 0s 0.39% 24 * 0s Profile articleAssignParentInternal: 0s 0.28% 8 * 0s Profile oxviewconfig::setViewConfigParam: 0s 0.18% 16 * 0s -
Bindung O'BRIEN DECADE CT 2010
 cl=oxwarticlebox(show/hide)Memory usage: 3.576 MB (peak: 3.64 MB)
System memory usage: 2 MB (peak: 2 MB)Executed: 2024-06-02 11:35:34Timestamp: 1717320934.2616Execution time:0.001
----------------------------------------------------------
Profile oxNew: 0.00963s 957.46% 147 * 7.0E-5s Profile process: 0.0052s 516.87% 7 * 0.00074s Profile oxAutoload: 0.0038s 377.99% 93 * 4.0E-5s Profile buildTree: 0.00244s 242.2% 1 * 0.00244s Profile loadinglists: 0.00195s 193.7% 3 * 0.00065s Profile getArticleUri: 0.00182s 181.33% 8 * 0.00023s Profile articleAssign: 0.00061s 60.95% 8 * 8.0E-5s Profile _getAmountPrice: 0.00055s 54.38% 5 * 0.00011s Profile getArticleMainUri: 0.00054s 53.29% 4 * 0.00013s Profile seoencoder_loadFromCache: 0.00047s 46.56% 36 * 1.0E-5s Profile executeMaintenanceTasks: 0.0003s 30.12% 1 * 0.0003s Profile getCategoryUri: 0.00012s 12.42% 2 * 6.0E-5s Profile _getLangTranslationArray: 0.00011s 10.66% 60 * 0s Profile smarty_function_oxmultilang: 0.00011s 10.55% 39 * 0s Profile _assignPriceInternal: 9.0E-5s 9.22% 5 * 2.0E-5s Profile fround: 2.0E-5s 1.8% 46 * 0s Profile isSearchEngine: 1.0E-5s 0.81% 1 * 1.0E-5s Profile _applyVAT: 1.0E-5s 0.52% 10 * 0s Profile oxviewconfig::getViewConfigParam: 0s 0.4% 25 * 0s Profile articleAssignParentInternal: 0s 0.28% 8 * 0s Profile oxviewconfig::setViewConfigParam: 0s 0.19% 18 * 0s -
Kuyichi Ledergürtel JEVER
 cl=oxwarticlebox(show/hide)Memory usage: 3.609 MB (peak: 3.673 MB)
System memory usage: 2 MB (peak: 2 MB)Executed: 2024-06-02 11:35:34Timestamp: 1717320934.2626Execution time:0.001
----------------------------------------------------------
Profile oxNew: 0.00964s 993.83% 154 * 6.0E-5s Profile process: 0.00617s 635.73% 8 * 0.00077s Profile oxAutoload: 0.0038s 392.01% 93 * 4.0E-5s Profile buildTree: 0.00244s 251.19% 1 * 0.00244s Profile getArticleUri: 0.00222s 229.2% 9 * 0.00025s Profile loadinglists: 0.00195s 200.88% 3 * 0.00065s Profile getArticleMainUri: 0.00066s 68.15% 5 * 0.00013s Profile articleAssign: 0.00061s 63.21% 8 * 8.0E-5s Profile _getAmountPrice: 0.0006s 61.66% 6 * 0.0001s Profile seoencoder_loadFromCache: 0.00047s 48.51% 39 * 1.0E-5s Profile executeMaintenanceTasks: 0.0003s 31.24% 1 * 0.0003s Profile getCategoryUri: 0.00012s 12.88% 2 * 6.0E-5s Profile smarty_function_oxmultilang: 0.00011s 11.55% 42 * 0s Profile _getLangTranslationArray: 0.00011s 11.48% 64 * 0s Profile _assignPriceInternal: 0.0001s 9.88% 6 * 2.0E-5s Profile fround: 2.0E-5s 1.97% 53 * 0s Profile isSearchEngine: 1.0E-5s 0.84% 1 * 1.0E-5s Profile _applyVAT: 1.0E-5s 0.64% 12 * 0s Profile oxviewconfig::getViewConfigParam: 1.0E-5s 0.52% 26 * 0s Profile articleAssignParentInternal: 0s 0.29% 8 * 0s Profile oxviewconfig::setViewConfigParam: 0s 0.29% 20 * 0s
cl=oxwarticledetails(show/hide)
Memory usage: 3.729 MB (peak: 3.932 MB)
System memory usage: 4 MB (peak: 4 MB)
----------------------------------------------------------
System memory usage: 4 MB (peak: 4 MB)
Executed: 2024-06-02 11:35:34
Timestamp: 1717320934.265
Execution time:0.0024----------------------------------------------------------
| Profile oxNew: | 0.0099s | 421.29% | 164 | * | 6.0E-5s |
| Profile process: | 0.00933s | 396.65% | 9 | * | 0.00104s |
| Profile oxAutoload: | 0.00387s | 164.66% | 95 | * | 4.0E-5s |
| Profile loadinglists: | 0.0028s | 119.04% | 5 | * | 0.00056s |
| Profile buildTree: | 0.00244s | 103.65% | 1 | * | 0.00244s |
| Profile getArticleUri: | 0.00222s | 94.57% | 9 | * | 0.00025s |
| Profile getArticleMainUri: | 0.00066s | 28.12% | 5 | * | 0.00013s |
| Profile articleAssign: | 0.00061s | 26.08% | 8 | * | 8.0E-5s |
| Profile _getAmountPrice: | 0.0006s | 25.44% | 6 | * | 0.0001s |
| Profile seoencoder_loadFromCache: | 0.00047s | 20.02% | 39 | * | 1.0E-5s |
| Profile executeMaintenanceTasks: | 0.0003s | 12.89% | 1 | * | 0.0003s |
| Profile getCategoryUri: | 0.00012s | 5.31% | 2 | * | 6.0E-5s |
| Profile smarty_function_oxmultilang: | 0.00012s | 5.19% | 45 | * | 0s |
| Profile _getLangTranslationArray: | 0.00012s | 5.04% | 70 | * | 0s |
| Profile _assignPriceInternal: | 0.0001s | 4.08% | 6 | * | 2.0E-5s |
| Profile fround: | 2.0E-5s | 0.81% | 53 | * | 0s |
| Profile isSearchEngine: | 1.0E-5s | 0.34% | 1 | * | 1.0E-5s |
| Profile _applyVAT: | 1.0E-5s | 0.26% | 12 | * | 0s |
| Profile oxviewconfig::getViewConfigParam: | 1.0E-5s | 0.25% | 28 | * | 0s |
| Profile articleAssignParentInternal: | 0s | 0.12% | 8 | * | 0s |
| Profile oxviewconfig::setViewConfigParam: | 0s | 0.12% | 23 | * | 0s |