 Sie haben Ihr Passwort vergessen?
Stickerset MIX
Artikel zurück
Artikel 2 VON 2

Kunden, die diesen Artikel gekauft haben, kauften auch:
-
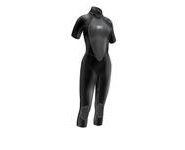
Neoprenanzug NPX VAMP
 cl=oxwarticlebox(show/hide)Memory usage: 3.493 MB (peak: 3.555 MB)
System memory usage: 2 MB (peak: 2 MB)Executed: 2024-06-03 01:29:03Timestamp: 1717370943.0599Execution time:0.0013
----------------------------------------------------------
Profile oxNew: 0.00698s 540.94% 124 * 6.0E-5s Profile oxAutoload: 0.0029s 224.95% 93 * 3.0E-5s Profile process: 0.00211s 163.46% 4 * 0.00053s Profile loadinglists: 0.00201s 156.18% 3 * 0.00067s Profile buildTree: 0.00148s 114.42% 1 * 0.00148s Profile articleAssign: 0.00061s 47.03% 8 * 8.0E-5s Profile getArticleUri: 0.00057s 44.39% 5 * 0.00011s Profile seoencoder_loadFromCache: 0.00042s 32.75% 25 * 2.0E-5s Profile _getAmountPrice: 0.0004s 30.77% 2 * 0.0002s Profile getArticleMainUri: 0.00015s 11.33% 1 * 0.00015s Profile executeMaintenanceTasks: 0.00013s 10.39% 1 * 0.00013s Profile _getLangTranslationArray: 9.0E-5s 7.24% 45 * 0s Profile _assignPriceInternal: 9.0E-5s 6.82% 2 * 4.0E-5s Profile getCategoryUri: 8.0E-5s 6.43% 2 * 4.0E-5s Profile smarty_function_oxmultilang: 8.0E-5s 6.1% 31 * 0s Profile fround: 1.0E-5s 0.91% 23 * 0s Profile articleAssignParentInternal: 1.0E-5s 0.41% 8 * 0s Profile isSearchEngine: 0s 0.31% 1 * 0s Profile _applyVAT: 0s 0.31% 4 * 0s Profile oxviewconfig::getViewConfigParam: 0s 0.3% 22 * 0s Profile oxviewconfig::setViewConfigParam: 0s 0% 12 * 0s -
Kiteboard CABRINHA CALIBER 2011
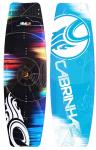 479,00 € * In den Warenkorbcl=oxwarticlebox(show/hide)Memory usage: 3.524 MB (peak: 3.589 MB)
System memory usage: 2 MB (peak: 2 MB)Executed: 2024-06-03 01:29:03Timestamp: 1717370943.0609Execution time:0.001
----------------------------------------------------------
Profile oxNew: 0.00699s 673.63% 131 * 5.0E-5s Profile process: 0.00314s 302.71% 5 * 0.00063s Profile oxAutoload: 0.0029s 279.62% 93 * 3.0E-5s Profile loadinglists: 0.00201s 194.14% 3 * 0.00067s Profile buildTree: 0.00148s 142.22% 1 * 0.00148s Profile getArticleUri: 0.001s 96.78% 6 * 0.00017s Profile articleAssign: 0.00061s 58.47% 8 * 8.0E-5s Profile _getAmountPrice: 0.00045s 43.44% 3 * 0.00015s Profile seoencoder_loadFromCache: 0.00043s 40.98% 28 * 2.0E-5s Profile getArticleMainUri: 0.00028s 27.2% 2 * 0.00014s Profile executeMaintenanceTasks: 0.00013s 12.91% 1 * 0.00013s Profile _getLangTranslationArray: 0.0001s 9.19% 48 * 0s Profile _assignPriceInternal: 9.0E-5s 8.78% 3 * 3.0E-5s Profile smarty_function_oxmultilang: 8.0E-5s 8.18% 33 * 0s Profile getCategoryUri: 8.0E-5s 7.99% 2 * 4.0E-5s Profile fround: 1.0E-5s 1.13% 29 * 0s Profile _applyVAT: 1.0E-5s 0.57% 6 * 0s Profile articleAssignParentInternal: 1.0E-5s 0.51% 8 * 0s Profile isSearchEngine: 0s 0.39% 1 * 0s Profile oxviewconfig::getViewConfigParam: 0s 0.37% 23 * 0s Profile oxviewconfig::setViewConfigParam: 0s 0.09% 14 * 0s -
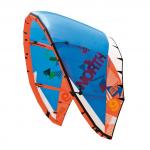
Kite NBK REBEL 2010
 799,00 € * In den Warenkorbcl=oxwarticlebox(show/hide)Memory usage: 3.542 MB (peak: 3.605 MB)
System memory usage: 2 MB (peak: 2 MB)Executed: 2024-06-03 01:29:03Timestamp: 1717370943.0621Execution time:0.0011
----------------------------------------------------------
Profile oxNew: 0.007s 648.78% 138 * 5.0E-5s Profile process: 0.00422s 390.76% 6 * 0.0007s Profile oxAutoload: 0.0029s 268.94% 93 * 3.0E-5s Profile loadinglists: 0.00201s 186.72% 3 * 0.00067s Profile buildTree: 0.00148s 136.79% 1 * 0.00148s Profile getArticleUri: 0.00141s 130.71% 7 * 0.0002s Profile articleAssign: 0.00061s 56.23% 8 * 8.0E-5s Profile _getAmountPrice: 0.00057s 53.18% 4 * 0.00014s Profile seoencoder_loadFromCache: 0.00043s 39.68% 31 * 1.0E-5s Profile getArticleMainUri: 0.00042s 39.04% 3 * 0.00014s Profile executeMaintenanceTasks: 0.00013s 12.42% 1 * 0.00013s Profile _getLangTranslationArray: 0.0001s 9.13% 51 * 0s Profile _assignPriceInternal: 9.0E-5s 8.73% 4 * 2.0E-5s Profile smarty_function_oxmultilang: 9.0E-5s 8.24% 35 * 0s Profile getCategoryUri: 8.0E-5s 7.69% 2 * 4.0E-5s Profile fround: 1.0E-5s 1.28% 35 * 0s Profile _applyVAT: 1.0E-5s 0.64% 8 * 0s Profile articleAssignParentInternal: 1.0E-5s 0.49% 8 * 0s Profile isSearchEngine: 0s 0.38% 1 * 0s Profile oxviewconfig::getViewConfigParam: 0s 0.35% 24 * 0s Profile oxviewconfig::setViewConfigParam: 0s 0.09% 16 * 0s -
Trapez ION SOL KITE 2011
 cl=oxwarticlebox(show/hide)Memory usage: 3.574 MB (peak: 3.638 MB)
System memory usage: 2 MB (peak: 2 MB)Executed: 2024-06-03 01:29:03Timestamp: 1717370943.0632Execution time:0.0011
----------------------------------------------------------
Profile oxNew: 0.00701s 618.11% 145 * 5.0E-5s Profile process: 0.00535s 471.2% 7 * 0.00076s Profile oxAutoload: 0.0029s 255.71% 93 * 3.0E-5s Profile loadinglists: 0.00201s 177.54% 3 * 0.00067s Profile getArticleUri: 0.00186s 164.29% 8 * 0.00023s Profile buildTree: 0.00148s 130.06% 1 * 0.00148s Profile _getAmountPrice: 0.00064s 56.03% 5 * 0.00013s Profile getArticleMainUri: 0.00061s 53.53% 4 * 0.00015s Profile articleAssign: 0.00061s 53.47% 8 * 8.0E-5s Profile seoencoder_loadFromCache: 0.00043s 37.98% 34 * 1.0E-5s Profile executeMaintenanceTasks: 0.00013s 11.81% 1 * 0.00013s Profile _getLangTranslationArray: 0.0001s 9.12% 55 * 0s Profile _assignPriceInternal: 0.0001s 8.66% 5 * 2.0E-5s Profile smarty_function_oxmultilang: 0.0001s 8.55% 38 * 0s Profile getCategoryUri: 8.0E-5s 7.31% 2 * 4.0E-5s Profile fround: 1.0E-5s 1.22% 42 * 0s Profile _applyVAT: 1.0E-5s 0.69% 10 * 0s Profile articleAssignParentInternal: 1.0E-5s 0.46% 8 * 0s Profile isSearchEngine: 0s 0.36% 1 * 0s Profile oxviewconfig::getViewConfigParam: 0s 0.34% 25 * 0s Profile oxviewconfig::setViewConfigParam: 0s 0.08% 18 * 0s -
Kite NBK EVO 2010
 699,00 € * In den Warenkorbcl=oxwarticlebox(show/hide)Memory usage: 3.607 MB (peak: 3.671 MB)
System memory usage: 2 MB (peak: 2 MB)Executed: 2024-06-03 01:29:03Timestamp: 1717370943.0646Execution time:0.0013
----------------------------------------------------------
Profile oxNew: 0.00703s 539.97% 152 * 5.0E-5s Profile process: 0.00664s 510.33% 8 * 0.00083s Profile oxAutoload: 0.0029s 222.89% 93 * 3.0E-5s Profile getArticleUri: 0.00246s 188.88% 9 * 0.00027s Profile loadinglists: 0.00201s 154.75% 3 * 0.00067s Profile buildTree: 0.00148s 113.37% 1 * 0.00148s Profile getArticleMainUri: 0.00075s 57.81% 5 * 0.00015s Profile _getAmountPrice: 0.00074s 56.67% 6 * 0.00012s Profile articleAssign: 0.00061s 46.6% 8 * 8.0E-5s Profile seoencoder_loadFromCache: 0.00043s 33.27% 37 * 1.0E-5s Profile executeMaintenanceTasks: 0.00013s 10.29% 1 * 0.00013s Profile _getLangTranslationArray: 0.00011s 8.2% 58 * 0s Profile smarty_function_oxmultilang: 0.0001s 7.84% 40 * 0s Profile _assignPriceInternal: 0.0001s 7.76% 6 * 2.0E-5s Profile getCategoryUri: 8.0E-5s 6.37% 2 * 4.0E-5s Profile fround: 1.0E-5s 1.06% 48 * 0s Profile _applyVAT: 1.0E-5s 0.82% 12 * 0s Profile articleAssignParentInternal: 1.0E-5s 0.4% 8 * 0s Profile isSearchEngine: 0s 0.31% 1 * 0s Profile oxviewconfig::getViewConfigParam: 0s 0.29% 26 * 0s Profile oxviewconfig::setViewConfigParam: 0s 0.07% 20 * 0s
cl=oxwarticledetails(show/hide)
Memory usage: 3.729 MB (peak: 3.927 MB)
System memory usage: 4 MB (peak: 4 MB)
----------------------------------------------------------
System memory usage: 4 MB (peak: 4 MB)
Executed: 2024-06-03 01:29:03
Timestamp: 1717370943.0672
Execution time:0.0026----------------------------------------------------------
| Profile process: | 0.0101s | 389.72% | 9 | * | 0.00112s |
| Profile oxNew: | 0.0073s | 281.9% | 162 | * | 5.0E-5s |
| Profile loadinglists: | 0.00312s | 120.56% | 5 | * | 0.00062s |
| Profile oxAutoload: | 0.00297s | 114.59% | 95 | * | 3.0E-5s |
| Profile getArticleUri: | 0.00246s | 94.91% | 9 | * | 0.00027s |
| Profile buildTree: | 0.00148s | 56.97% | 1 | * | 0.00148s |
| Profile getArticleMainUri: | 0.00075s | 29.05% | 5 | * | 0.00015s |
| Profile _getAmountPrice: | 0.00074s | 28.48% | 6 | * | 0.00012s |
| Profile articleAssign: | 0.00061s | 23.42% | 8 | * | 8.0E-5s |
| Profile seoencoder_loadFromCache: | 0.00043s | 16.72% | 37 | * | 1.0E-5s |
| Profile executeMaintenanceTasks: | 0.00013s | 5.17% | 1 | * | 0.00013s |
| Profile _getLangTranslationArray: | 0.00012s | 4.44% | 64 | * | 0s |
| Profile smarty_function_oxmultilang: | 0.00011s | 4.33% | 43 | * | 0s |
| Profile _assignPriceInternal: | 0.0001s | 3.9% | 6 | * | 2.0E-5s |
| Profile getCategoryUri: | 8.0E-5s | 3.2% | 2 | * | 4.0E-5s |
| Profile fround: | 1.0E-5s | 0.53% | 48 | * | 0s |
| Profile _applyVAT: | 1.0E-5s | 0.41% | 12 | * | 0s |
| Profile articleAssignParentInternal: | 1.0E-5s | 0.2% | 8 | * | 0s |
| Profile isSearchEngine: | 0s | 0.16% | 1 | * | 0s |
| Profile oxviewconfig::getViewConfigParam: | 0s | 0.15% | 28 | * | 0s |
| Profile oxviewconfig::setViewConfigParam: | 0s | 0.12% | 23 | * | 0s |