 Sie haben Ihr Passwort vergessen?
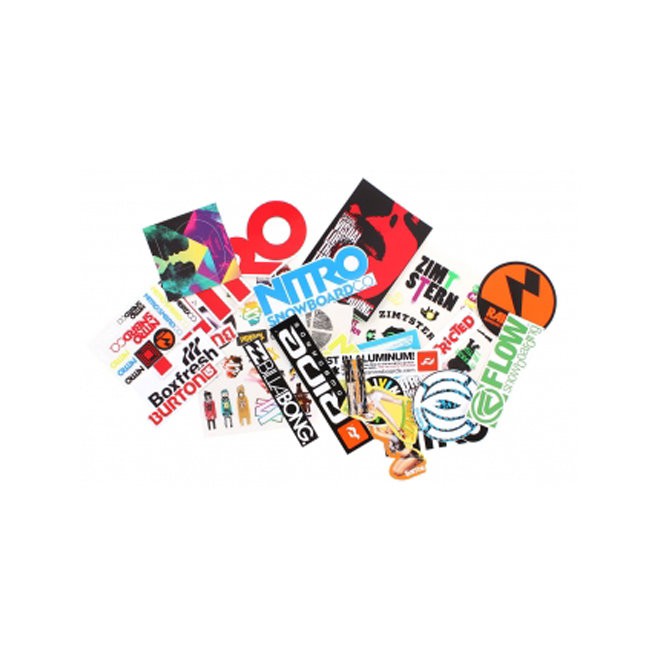
Stickerset MIX
Artikel zurück
Artikel 2 VON 2
Kunden, die diesen Artikel gekauft haben, kauften auch:
-
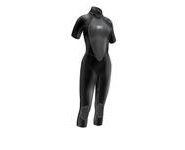
Neoprenanzug NPX VAMP
 cl=oxwarticlebox(show/hide)Memory usage: 3.493 MB (peak: 3.555 MB)
System memory usage: 2 MB (peak: 2 MB)Executed: 2024-06-03 00:37:50Timestamp: 1717367870.7083Execution time:0.0013
----------------------------------------------------------
Profile oxNew: 0.00694s 528.68% 124 * 6.0E-5s Profile oxAutoload: 0.0029s 220.99% 93 * 3.0E-5s Profile loadinglists: 0.00218s 166.02% 3 * 0.00073s Profile process: 0.00214s 163.42% 4 * 0.00054s Profile buildTree: 0.00143s 109.14% 1 * 0.00143s Profile articleAssign: 0.0006s 45.39% 8 * 7.0E-5s Profile getArticleUri: 0.00057s 43.38% 5 * 0.00011s Profile seoencoder_loadFromCache: 0.00042s 32.18% 25 * 2.0E-5s Profile _getAmountPrice: 0.00038s 29.13% 2 * 0.00019s Profile getArticleMainUri: 0.00014s 10.9% 1 * 0.00014s Profile executeMaintenanceTasks: 0.00014s 10.45% 1 * 0.00014s Profile _assignPriceInternal: 9.0E-5s 7% 2 * 5.0E-5s Profile smarty_function_oxmultilang: 9.0E-5s 6.58% 31 * 0s Profile _getLangTranslationArray: 8.0E-5s 6.4% 45 * 0s Profile getCategoryUri: 8.0E-5s 6.09% 2 * 4.0E-5s Profile fround: 1.0E-5s 0.78% 23 * 0s Profile isSearchEngine: 1.0E-5s 0.38% 1 * 1.0E-5s Profile articleAssignParentInternal: 0s 0.36% 8 * 0s Profile _applyVAT: 0s 0.29% 4 * 0s Profile oxviewconfig::getViewConfigParam: 0s 0.22% 22 * 0s Profile oxviewconfig::setViewConfigParam: 0s 0.16% 12 * 0s -
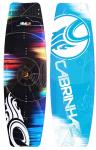
Kiteboard CABRINHA CALIBER 2011
 479,00 € * In den Warenkorbcl=oxwarticlebox(show/hide)Memory usage: 3.524 MB (peak: 3.589 MB)
System memory usage: 2 MB (peak: 2 MB)Executed: 2024-06-03 00:37:50Timestamp: 1717367870.7093Execution time:0.001
----------------------------------------------------------
Profile oxNew: 0.00695s 677.69% 131 * 5.0E-5s Profile process: 0.00317s 308.79% 5 * 0.00063s Profile oxAutoload: 0.0029s 282.88% 93 * 3.0E-5s Profile loadinglists: 0.00218s 212.51% 3 * 0.00073s Profile buildTree: 0.00143s 139.71% 1 * 0.00143s Profile getArticleUri: 0.00099s 96.51% 6 * 0.00016s Profile articleAssign: 0.0006s 58.11% 8 * 7.0E-5s Profile _getAmountPrice: 0.00044s 42.45% 3 * 0.00015s Profile seoencoder_loadFromCache: 0.00043s 41.52% 28 * 2.0E-5s Profile getArticleMainUri: 0.00027s 26.54% 2 * 0.00014s Profile executeMaintenanceTasks: 0.00014s 13.38% 1 * 0.00014s Profile _assignPriceInternal: 9.0E-5s 9.26% 3 * 3.0E-5s Profile smarty_function_oxmultilang: 9.0E-5s 9% 33 * 0s Profile _getLangTranslationArray: 9.0E-5s 8.47% 48 * 0s Profile getCategoryUri: 8.0E-5s 7.79% 2 * 4.0E-5s Profile fround: 1.0E-5s 1.09% 29 * 0s Profile _applyVAT: 1.0E-5s 0.56% 6 * 0s Profile isSearchEngine: 1.0E-5s 0.49% 1 * 1.0E-5s Profile articleAssignParentInternal: 0s 0.47% 8 * 0s Profile oxviewconfig::getViewConfigParam: 0s 0.28% 23 * 0s Profile oxviewconfig::setViewConfigParam: 0s 0.21% 14 * 0s -
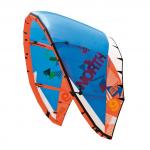
Kite NBK REBEL 2010
 799,00 € * In den Warenkorbcl=oxwarticlebox(show/hide)Memory usage: 3.542 MB (peak: 3.605 MB)
System memory usage: 2 MB (peak: 2 MB)Executed: 2024-06-03 00:37:50Timestamp: 1717367870.7103Execution time:0.001
----------------------------------------------------------
Profile oxNew: 0.00696s 708.45% 138 * 5.0E-5s Profile process: 0.00414s 421.87% 6 * 0.00069s Profile oxAutoload: 0.0029s 295.24% 93 * 3.0E-5s Profile loadinglists: 0.00218s 221.8% 3 * 0.00073s Profile buildTree: 0.00143s 145.81% 1 * 0.00143s Profile getArticleUri: 0.00139s 141.66% 7 * 0.0002s Profile articleAssign: 0.0006s 60.65% 8 * 7.0E-5s Profile _getAmountPrice: 0.00049s 49.5% 4 * 0.00012s Profile seoencoder_loadFromCache: 0.00043s 43.53% 31 * 1.0E-5s Profile getArticleMainUri: 0.0004s 40.54% 3 * 0.00013s Profile executeMaintenanceTasks: 0.00014s 13.96% 1 * 0.00014s Profile _assignPriceInternal: 0.0001s 9.95% 4 * 2.0E-5s Profile smarty_function_oxmultilang: 0.0001s 9.81% 35 * 0s Profile _getLangTranslationArray: 9.0E-5s 8.93% 51 * 0s Profile getCategoryUri: 8.0E-5s 8.13% 2 * 4.0E-5s Profile fround: 1.0E-5s 1.24% 35 * 0s Profile _applyVAT: 1.0E-5s 0.8% 8 * 0s Profile isSearchEngine: 1.0E-5s 0.51% 1 * 1.0E-5s Profile articleAssignParentInternal: 0s 0.49% 8 * 0s Profile oxviewconfig::setViewConfigParam: 0s 0.32% 16 * 0s Profile oxviewconfig::getViewConfigParam: 0s 0.29% 24 * 0s -
Trapez ION SOL KITE 2011
 cl=oxwarticlebox(show/hide)Memory usage: 3.574 MB (peak: 3.638 MB)
System memory usage: 2 MB (peak: 2 MB)Executed: 2024-06-03 00:37:50Timestamp: 1717367870.7114Execution time:0.001
----------------------------------------------------------
Profile oxNew: 0.00697s 666.8% 145 * 5.0E-5s Profile process: 0.00518s 496.08% 7 * 0.00074s Profile oxAutoload: 0.0029s 277.46% 93 * 3.0E-5s Profile loadinglists: 0.00218s 208.44% 3 * 0.00073s Profile getArticleUri: 0.00182s 173.99% 8 * 0.00023s Profile buildTree: 0.00143s 137.03% 1 * 0.00143s Profile articleAssign: 0.0006s 56.99% 8 * 7.0E-5s Profile _getAmountPrice: 0.00054s 51.4% 5 * 0.00011s Profile getArticleMainUri: 0.00052s 50.15% 4 * 0.00013s Profile seoencoder_loadFromCache: 0.00043s 41% 34 * 1.0E-5s Profile executeMaintenanceTasks: 0.00014s 13.12% 1 * 0.00014s Profile smarty_function_oxmultilang: 0.0001s 9.86% 38 * 0s Profile _assignPriceInternal: 0.0001s 9.54% 5 * 2.0E-5s Profile _getLangTranslationArray: 9.0E-5s 8.69% 55 * 0s Profile getCategoryUri: 8.0E-5s 7.64% 2 * 4.0E-5s Profile fround: 1.0E-5s 1.16% 42 * 0s Profile _applyVAT: 1.0E-5s 0.75% 10 * 0s Profile isSearchEngine: 1.0E-5s 0.48% 1 * 1.0E-5s Profile articleAssignParentInternal: 0s 0.46% 8 * 0s Profile oxviewconfig::setViewConfigParam: 0s 0.3% 18 * 0s Profile oxviewconfig::getViewConfigParam: 0s 0.27% 25 * 0s -
Kite NBK EVO 2010
 699,00 € * In den Warenkorbcl=oxwarticlebox(show/hide)Memory usage: 3.607 MB (peak: 3.671 MB)
System memory usage: 2 MB (peak: 2 MB)Executed: 2024-06-03 00:37:50Timestamp: 1717367870.7124Execution time:0.001
----------------------------------------------------------
Profile oxNew: 0.00698s 732.17% 152 * 5.0E-5s Profile process: 0.00613s 643.68% 8 * 0.00077s Profile oxAutoload: 0.0029s 304.25% 93 * 3.0E-5s Profile getArticleUri: 0.00221s 231.95% 9 * 0.00025s Profile loadinglists: 0.00218s 228.57% 3 * 0.00073s Profile buildTree: 0.00143s 150.26% 1 * 0.00143s Profile getArticleMainUri: 0.00065s 67.9% 5 * 0.00013s Profile articleAssign: 0.0006s 62.5% 8 * 7.0E-5s Profile _getAmountPrice: 0.00059s 61.5% 6 * 0.0001s Profile seoencoder_loadFromCache: 0.00043s 45.28% 37 * 1.0E-5s Profile executeMaintenanceTasks: 0.00014s 14.39% 1 * 0.00014s Profile smarty_function_oxmultilang: 0.00011s 11.21% 40 * 0s Profile _assignPriceInternal: 0.0001s 10.68% 6 * 2.0E-5s Profile _getLangTranslationArray: 9.0E-5s 9.73% 58 * 0s Profile getCategoryUri: 8.0E-5s 8.38% 2 * 4.0E-5s Profile fround: 1.0E-5s 1.28% 48 * 0s Profile _applyVAT: 1.0E-5s 0.93% 12 * 0s Profile isSearchEngine: 1.0E-5s 0.53% 1 * 1.0E-5s Profile articleAssignParentInternal: 0s 0.5% 8 * 0s Profile oxviewconfig::setViewConfigParam: 0s 0.33% 20 * 0s Profile oxviewconfig::getViewConfigParam: 0s 0.3% 26 * 0s
cl=oxwarticledetails(show/hide)
Memory usage: 3.729 MB (peak: 3.927 MB)
System memory usage: 4 MB (peak: 4 MB)
----------------------------------------------------------
System memory usage: 4 MB (peak: 4 MB)
Executed: 2024-06-03 00:37:50
Timestamp: 1717367870.7147
Execution time:0.0023----------------------------------------------------------
| Profile process: | 0.00923s | 408.96% | 9 | * | 0.00103s |
| Profile oxNew: | 0.00724s | 320.63% | 162 | * | 4.0E-5s |
| Profile loadinglists: | 0.00306s | 135.42% | 5 | * | 0.00061s |
| Profile oxAutoload: | 0.00297s | 131.45% | 95 | * | 3.0E-5s |
| Profile getArticleUri: | 0.00221s | 97.94% | 9 | * | 0.00025s |
| Profile buildTree: | 0.00143s | 63.45% | 1 | * | 0.00143s |
| Profile getArticleMainUri: | 0.00065s | 28.67% | 5 | * | 0.00013s |
| Profile articleAssign: | 0.0006s | 26.39% | 8 | * | 7.0E-5s |
| Profile _getAmountPrice: | 0.00059s | 25.97% | 6 | * | 0.0001s |
| Profile seoencoder_loadFromCache: | 0.00043s | 19.12% | 37 | * | 1.0E-5s |
| Profile executeMaintenanceTasks: | 0.00014s | 6.07% | 1 | * | 0.00014s |
| Profile smarty_function_oxmultilang: | 0.00012s | 5.19% | 43 | * | 0s |
| Profile _assignPriceInternal: | 0.0001s | 4.51% | 6 | * | 2.0E-5s |
| Profile _getLangTranslationArray: | 0.0001s | 4.47% | 64 | * | 0s |
| Profile getCategoryUri: | 8.0E-5s | 3.54% | 2 | * | 4.0E-5s |
| Profile fround: | 1.0E-5s | 0.54% | 48 | * | 0s |
| Profile _applyVAT: | 1.0E-5s | 0.39% | 12 | * | 0s |
| Profile isSearchEngine: | 1.0E-5s | 0.22% | 1 | * | 1.0E-5s |
| Profile articleAssignParentInternal: | 0s | 0.21% | 8 | * | 0s |
| Profile oxviewconfig::setViewConfigParam: | 0s | 0.18% | 23 | * | 0s |
| Profile oxviewconfig::getViewConfigParam: | 0s | 0.13% | 28 | * | 0s |