 Sie haben Ihr Passwort vergessen?
Stickerset MIX
Artikel zurück
Artikel 2 VON 2
Kunden, die diesen Artikel gekauft haben, kauften auch:
-
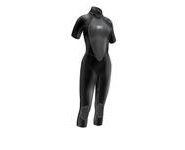
Neoprenanzug NPX VAMP
 cl=oxwarticlebox(show/hide)Memory usage: 3.493 MB (peak: 3.556 MB)
System memory usage: 2 MB (peak: 2 MB)Executed: 2024-06-11 10:01:39Timestamp: 1718092899.8858Execution time:0.0013
----------------------------------------------------------
Profile oxNew: 0.00734s 562.14% 124 * 6.0E-5s Profile oxAutoload: 0.00301s 230.74% 93 * 3.0E-5s Profile loadinglists: 0.00241s 184.68% 3 * 0.0008s Profile process: 0.00229s 175.12% 4 * 0.00057s Profile buildTree: 0.00144s 110.55% 1 * 0.00144s Profile articleAssign: 0.0006s 45.6% 8 * 7.0E-5s Profile getArticleUri: 0.00059s 45.4% 5 * 0.00012s Profile seoencoder_loadFromCache: 0.00044s 33.48% 25 * 2.0E-5s Profile _getAmountPrice: 0.00039s 29.68% 2 * 0.00019s Profile getArticleMainUri: 0.00014s 10.95% 1 * 0.00014s Profile executeMaintenanceTasks: 0.00013s 10.33% 1 * 0.00013s Profile smarty_function_oxmultilang: 9.0E-5s 6.94% 31 * 0s Profile _assignPriceInternal: 9.0E-5s 6.64% 2 * 4.0E-5s Profile _getLangTranslationArray: 9.0E-5s 6.61% 45 * 0s Profile getCategoryUri: 8.0E-5s 6.3% 2 * 4.0E-5s Profile fround: 1.0E-5s 0.84% 23 * 0s Profile articleAssignParentInternal: 1.0E-5s 0.4% 8 * 0s Profile isSearchEngine: 1.0E-5s 0.38% 1 * 1.0E-5s Profile oxviewconfig::getViewConfigParam: 0s 0.24% 22 * 0s Profile _applyVAT: 0s 0.16% 4 * 0s Profile oxviewconfig::setViewConfigParam: 0s 0.15% 12 * 0s -
Kiteboard CABRINHA CALIBER 2011
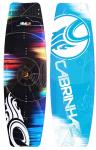 479,00 € * In den Warenkorbcl=oxwarticlebox(show/hide)Memory usage: 3.525 MB (peak: 3.59 MB)
System memory usage: 2 MB (peak: 2 MB)Executed: 2024-06-11 10:01:39Timestamp: 1718092899.8868Execution time:0.001
----------------------------------------------------------
Profile oxNew: 0.00735s 719.82% 131 * 6.0E-5s Profile process: 0.0033s 323.58% 5 * 0.00066s Profile oxAutoload: 0.00301s 295.12% 93 * 3.0E-5s Profile loadinglists: 0.00241s 236.21% 3 * 0.0008s Profile buildTree: 0.00144s 141.4% 1 * 0.00144s Profile getArticleUri: 0.001s 98.32% 6 * 0.00017s Profile articleAssign: 0.0006s 58.32% 8 * 7.0E-5s Profile _getAmountPrice: 0.00044s 43.17% 3 * 0.00015s Profile seoencoder_loadFromCache: 0.00044s 43.12% 28 * 2.0E-5s Profile getArticleMainUri: 0.00027s 26.64% 2 * 0.00014s Profile executeMaintenanceTasks: 0.00013s 13.22% 1 * 0.00013s Profile smarty_function_oxmultilang: 0.0001s 9.36% 33 * 0s Profile _getLangTranslationArray: 9.0E-5s 8.73% 48 * 0s Profile _assignPriceInternal: 9.0E-5s 8.69% 3 * 3.0E-5s Profile getCategoryUri: 8.0E-5s 8.06% 2 * 4.0E-5s Profile fround: 1.0E-5s 1.17% 29 * 0s Profile articleAssignParentInternal: 1.0E-5s 0.51% 8 * 0s Profile isSearchEngine: 1.0E-5s 0.49% 1 * 1.0E-5s Profile oxviewconfig::getViewConfigParam: 0s 0.3% 23 * 0s Profile _applyVAT: 0s 0.3% 6 * 0s Profile oxviewconfig::setViewConfigParam: 0s 0.19% 14 * 0s -
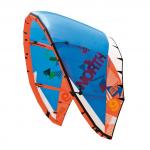
Kite NBK REBEL 2010
 799,00 € * In den Warenkorbcl=oxwarticlebox(show/hide)Memory usage: 3.542 MB (peak: 3.606 MB)
System memory usage: 2 MB (peak: 2 MB)Executed: 2024-06-11 10:01:39Timestamp: 1718092899.8879Execution time:0.001
----------------------------------------------------------
Profile oxNew: 0.00736s 743.32% 138 * 5.0E-5s Profile process: 0.00429s 433.3% 6 * 0.00072s Profile oxAutoload: 0.00301s 304.36% 93 * 3.0E-5s Profile loadinglists: 0.00241s 243.61% 3 * 0.0008s Profile buildTree: 0.00144s 145.82% 1 * 0.00144s Profile getArticleUri: 0.00141s 142.81% 7 * 0.0002s Profile articleAssign: 0.0006s 60.15% 8 * 7.0E-5s Profile _getAmountPrice: 0.00049s 49.87% 4 * 0.00012s Profile seoencoder_loadFromCache: 0.00044s 44.57% 31 * 1.0E-5s Profile getArticleMainUri: 0.0004s 40.4% 3 * 0.00013s Profile executeMaintenanceTasks: 0.00013s 13.63% 1 * 0.00013s Profile smarty_function_oxmultilang: 0.0001s 10.04% 35 * 0s Profile _assignPriceInternal: 9.0E-5s 9.17% 4 * 2.0E-5s Profile _getLangTranslationArray: 9.0E-5s 9.1% 51 * 0s Profile getCategoryUri: 8.0E-5s 8.31% 2 * 4.0E-5s Profile fround: 1.0E-5s 1.3% 35 * 0s Profile articleAssignParentInternal: 1.0E-5s 0.53% 8 * 0s Profile _applyVAT: 1.0E-5s 0.53% 8 * 0s Profile isSearchEngine: 1.0E-5s 0.51% 1 * 1.0E-5s Profile oxviewconfig::getViewConfigParam: 0s 0.31% 24 * 0s Profile oxviewconfig::setViewConfigParam: 0s 0.29% 16 * 0s -
Trapez ION SOL KITE 2011
 cl=oxwarticlebox(show/hide)Memory usage: 3.575 MB (peak: 3.639 MB)
System memory usage: 2 MB (peak: 2 MB)Executed: 2024-06-11 10:01:39Timestamp: 1718092899.8889Execution time:0.001
----------------------------------------------------------
Profile oxNew: 0.00737s 732.63% 145 * 5.0E-5s Profile process: 0.00529s 526.02% 7 * 0.00076s Profile oxAutoload: 0.00301s 299.53% 93 * 3.0E-5s Profile loadinglists: 0.00241s 239.74% 3 * 0.0008s Profile getArticleUri: 0.00183s 182.3% 8 * 0.00023s Profile buildTree: 0.00144s 143.51% 1 * 0.00144s Profile articleAssign: 0.0006s 59.19% 8 * 7.0E-5s Profile _getAmountPrice: 0.00054s 54.15% 5 * 0.00011s Profile getArticleMainUri: 0.00053s 52.27% 4 * 0.00013s Profile seoencoder_loadFromCache: 0.00044s 44.05% 34 * 1.0E-5s Profile executeMaintenanceTasks: 0.00013s 13.41% 1 * 0.00013s Profile smarty_function_oxmultilang: 0.00011s 10.57% 38 * 0s Profile _getLangTranslationArray: 9.0E-5s 9.38% 55 * 0s Profile _assignPriceInternal: 9.0E-5s 9.22% 5 * 2.0E-5s Profile getCategoryUri: 8.0E-5s 8.18% 2 * 4.0E-5s Profile fround: 1.0E-5s 1.4% 42 * 0s Profile _applyVAT: 1.0E-5s 0.73% 10 * 0s Profile articleAssignParentInternal: 1.0E-5s 0.52% 8 * 0s Profile isSearchEngine: 1.0E-5s 0.5% 1 * 1.0E-5s Profile oxviewconfig::getViewConfigParam: 0s 0.31% 25 * 0s Profile oxviewconfig::setViewConfigParam: 0s 0.28% 18 * 0s -
Kite NBK EVO 2010
 699,00 € * In den Warenkorbcl=oxwarticlebox(show/hide)Memory usage: 3.608 MB (peak: 3.672 MB)
System memory usage: 2 MB (peak: 2 MB)Executed: 2024-06-11 10:01:39Timestamp: 1718092899.8899Execution time:0.001
----------------------------------------------------------
Profile oxNew: 0.00738s 766.48% 152 * 5.0E-5s Profile process: 0.00625s 649.2% 8 * 0.00078s Profile oxAutoload: 0.00301s 312.95% 93 * 3.0E-5s Profile loadinglists: 0.00241s 250.48% 3 * 0.0008s Profile getArticleUri: 0.00222s 230.75% 9 * 0.00025s Profile buildTree: 0.00144s 149.94% 1 * 0.00144s Profile getArticleMainUri: 0.00065s 67.39% 5 * 0.00013s Profile _getAmountPrice: 0.0006s 61.87% 6 * 0.0001s Profile articleAssign: 0.0006s 61.85% 8 * 7.0E-5s Profile seoencoder_loadFromCache: 0.00044s 46.03% 37 * 1.0E-5s Profile executeMaintenanceTasks: 0.00013s 14.01% 1 * 0.00013s Profile smarty_function_oxmultilang: 0.00011s 11.56% 40 * 0s Profile _getLangTranslationArray: 0.0001s 10% 58 * 0s Profile _assignPriceInternal: 9.0E-5s 9.83% 6 * 2.0E-5s Profile getCategoryUri: 8.0E-5s 8.54% 2 * 4.0E-5s Profile fround: 1.0E-5s 1.46% 48 * 0s Profile _applyVAT: 1.0E-5s 0.89% 12 * 0s Profile articleAssignParentInternal: 1.0E-5s 0.54% 8 * 0s Profile isSearchEngine: 1.0E-5s 0.52% 1 * 1.0E-5s Profile oxviewconfig::getViewConfigParam: 0s 0.32% 26 * 0s Profile oxviewconfig::setViewConfigParam: 0s 0.3% 20 * 0s
cl=oxwarticledetails(show/hide)
Memory usage: 3.732 MB (peak: 3.931 MB)
System memory usage: 4 MB (peak: 4 MB)
----------------------------------------------------------
System memory usage: 4 MB (peak: 4 MB)
Executed: 2024-06-11 10:01:39
Timestamp: 1718092899.8922
Execution time:0.0022----------------------------------------------------------
| Profile process: | 0.0093s | 419.63% | 9 | * | 0.00103s |
| Profile oxNew: | 0.00764s | 345.03% | 162 | * | 5.0E-5s |
| Profile loadinglists: | 0.00326s | 147.05% | 5 | * | 0.00065s |
| Profile oxAutoload: | 0.00308s | 139.07% | 95 | * | 3.0E-5s |
| Profile getArticleUri: | 0.00222s | 100.31% | 9 | * | 0.00025s |
| Profile buildTree: | 0.00144s | 65.18% | 1 | * | 0.00144s |
| Profile getArticleMainUri: | 0.00065s | 29.3% | 5 | * | 0.00013s |
| Profile _getAmountPrice: | 0.0006s | 26.9% | 6 | * | 0.0001s |
| Profile articleAssign: | 0.0006s | 26.89% | 8 | * | 7.0E-5s |
| Profile seoencoder_loadFromCache: | 0.00044s | 20.01% | 37 | * | 1.0E-5s |
| Profile executeMaintenanceTasks: | 0.00013s | 6.09% | 1 | * | 0.00013s |
| Profile smarty_function_oxmultilang: | 0.00012s | 5.38% | 43 | * | 0s |
| Profile _getLangTranslationArray: | 0.0001s | 4.67% | 64 | * | 0s |
| Profile _assignPriceInternal: | 9.0E-5s | 4.27% | 6 | * | 2.0E-5s |
| Profile getCategoryUri: | 8.0E-5s | 3.71% | 2 | * | 4.0E-5s |
| Profile fround: | 1.0E-5s | 0.64% | 48 | * | 0s |
| Profile _applyVAT: | 1.0E-5s | 0.39% | 12 | * | 0s |
| Profile articleAssignParentInternal: | 1.0E-5s | 0.24% | 8 | * | 0s |
| Profile isSearchEngine: | 1.0E-5s | 0.23% | 1 | * | 1.0E-5s |
| Profile oxviewconfig::getViewConfigParam: | 0s | 0.19% | 28 | * | 0s |
| Profile oxviewconfig::setViewConfigParam: | 0s | 0.13% | 23 | * | 0s |